
Mathematics, 26.03.2021 18:30 natjojo0512
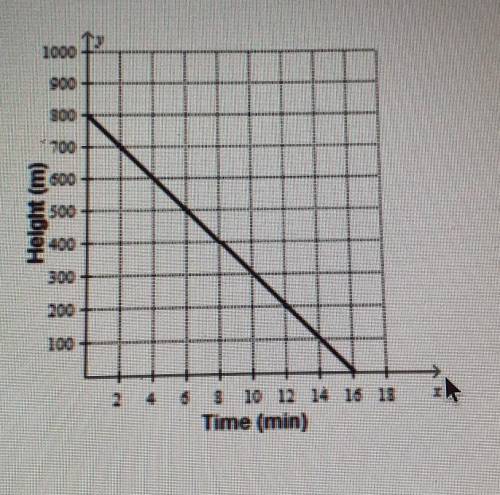
The graph below illustrates the movement of a gondola down from a mountain.
Which of these best represents the rate of change in the heights with respect to the time?
F. -50 meters per minute
G. -40 meters per minute
H. -80 meters per minute
J. -20 meters per minute
PLEASE ANSWER!!!

Answers: 2


Other questions on the subject: Mathematics
Mathematics, 21.06.2019 18:30, Snowinvain
An arc subtends a central angle measuring 7pi/4 radians what fraction of the circumference is this arc?
Answers: 1
Mathematics, 21.06.2019 22:30, patrickfryer240
When i'm with my factor 5, my prodect is 20 .when i'm with my addend 6' my sum is 10.what number am i
Answers: 1
Mathematics, 21.06.2019 23:00, angeladominguezgarci
If i purchase a product for $79.99 and two accessories for 9.99 and 7.00 how much will i owe after taxes applies 8.75%
Answers: 2
You know the right answer?
The graph below illustrates the movement of a gondola down from a mountain.
Which of these best rep...
Questions in other subjects:

Chemistry, 28.06.2019 13:20

Social Studies, 28.06.2019 13:20


Spanish, 28.06.2019 13:30

World Languages, 28.06.2019 13:30


