
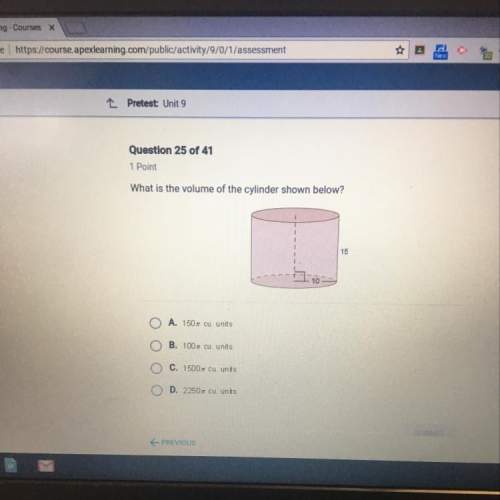
Mathematics, 26.03.2021 17:00 ipadguy1806
The scatter plot shows the relationship between the test scores of a group of students and the number of hours they spend on social media in a week:
A scatter plot is shown. The x-axis is labeled Hours spent on social media, and the y-axis is labeled test score. Data points are located at 0.5 and 100, 2 and 100, 1 and 95, 3 and 85, 3 and 78, 5 and 75, 5 and 72, 6 and 70, 6 and 98, 7 and 60. A circle labeled A includes all of the points except for the one at 6 and 98. Point 6 and 98 is labled B.
Part A: What is the group of points labeled A called? What is the point labeled B called? Give a possible reason for the presence of point B. (3 points)
Part B: Describe the association between a student's test scores and the number of hours spent on social media. (2 points)

Answers: 1


Other questions on the subject: Mathematics
Mathematics, 21.06.2019 21:00, cinthyafleitas
What number line represents the solution set for the inequality -1/2 greater than or equal to 4
Answers: 1
Mathematics, 21.06.2019 22:00, zurfluhe
Manuela claims that and are congruent. which statement best describes her claim? she is incorrect because the segments do not have the same orientation. she is incorrect because the segments do not have the same length. she is correct because the segments have the same length. she is correct because the segments have the same orientation.
Answers: 1
You know the right answer?
The scatter plot shows the relationship between the test scores of a group of students and the numbe...
Questions in other subjects:

Health, 13.02.2021 14:30
Mathematics, 13.02.2021 14:30


History, 13.02.2021 14:40

Chemistry, 13.02.2021 14:40


