
Mathematics, 26.03.2021 01:40 Weser17
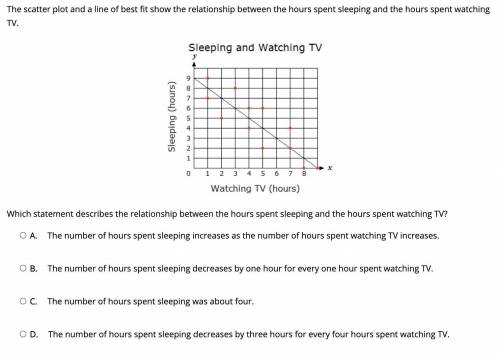
The scatter plot and a line of best fit show the relationship between the hours spent sleeping and the hours spent watching TV. Which statement describes the relationship between the hours spent sleeping and the hours spent watching TV?

Answers: 3


Other questions on the subject: Mathematics
Mathematics, 21.06.2019 15:50, wwwserban9281
In the following situation, determine whether you are asked to determine the number of permutations or combinations. then do the calculation how many ways are there to pick a starting five from a basketball team of twelve members? a. permutation; ps - 2520 b. combination; 1c, - 792 c. combination: 2cs - 2520 d. permutation; ps - 95040
Answers: 1
Mathematics, 21.06.2019 22:50, rileyeddins1010
Aweekly newspaper charges $72 for each inch in length and one column width. what is the cost of an ad that runs 2 column inches long and 2 columns wide? its not 288
Answers: 1
You know the right answer?
The scatter plot and a line of best fit show the relationship between the hours spent sleeping and t...
Questions in other subjects:
Mathematics, 28.01.2020 00:31


Biology, 28.01.2020 00:31

Social Studies, 28.01.2020 00:31

English, 28.01.2020 00:31


