
Mathematics, 26.03.2021 01:10 ladya1613
Data & Statistics 7.SP. A&B
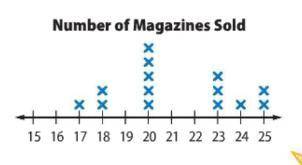
1. The Line Plot shows the number of magazines each member of the student council Sold. Find the mean, median, mode, range and any outliers of the data. Round the nearest tenth if needed. Then describe the data using them.
• Hint: Each x represents a student. For example, two students sold 18 magazines
MEAN: _ MEDIAN: _ MODE _
RANGE_ OUTLIERS _

Answers: 2


Other questions on the subject: Mathematics
Mathematics, 21.06.2019 15:00, gghkooo1987
This is the number of parts out of 100, the numerator of a fraction where the denominator is 100. submit
Answers: 3
Mathematics, 21.06.2019 23:30, brid695
Tatiana wants to give friendship bracelets to her 32 classmates. she already has 5 bracelets, and she can buy more bracelets in packages of 4. write an inequality to determine the number of packages, p, tatiana could buy to have enough bracelets.
Answers: 1
You know the right answer?
Data & Statistics 7.SP. A&B
1. The Line Plot shows the number of magazines each member of t...
Questions in other subjects:
Mathematics, 29.10.2020 21:10


Biology, 29.10.2020 21:10
Mathematics, 29.10.2020 21:10
Mathematics, 29.10.2020 21:10


