2.6
3.5
0.5
3.0
4.0
2.2
5.1
70
72
46
74
...

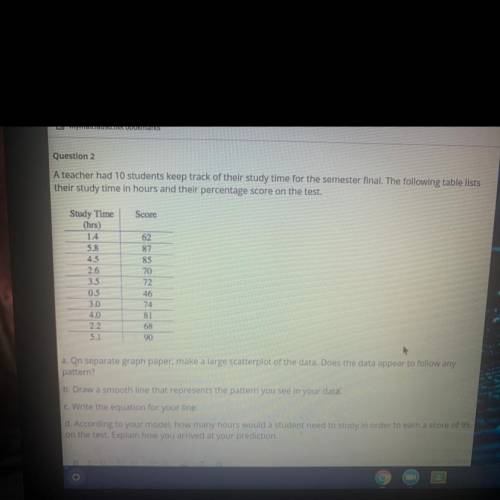
Mathematics, 25.03.2021 19:40 keananashville
2.6
3.5
0.5
3.0
4.0
2.2
5.1
70
72
46
74
81
68
90
a. On separate graph paper, make a large scatterplot of the data. Does the data appear to follow any
pattern?
b. Draw a smooth line that represents the pattern you see in your data.
C. Write the equation for your line.
d. According to your model, how many hours would a student need to study in order to earn a score of
on the test. Explain how you arrived at your prediction.
BLUESOSTO
Unn
O

Answers: 1


Other questions on the subject: Mathematics
Mathematics, 21.06.2019 16:30, victoria8281
Answer the following for 896.31 cm= km 100cm = 1m 1000m = 1km a) 0.0089631 b) 0.0089631 c) 8.9631 d) 89.631
Answers: 1
Mathematics, 21.06.2019 21:30, girlysimbelieve
Aroulette wheel has 38 slots in which the ball can land. two of the slots are green, 18 are red, and 18 are black. the ball is equally likely to land in any slot. the roulette wheel is going to be spun twice, and the outcomes of the two spins are independent. the probability that it lands one time on red and another time on black in any order is(a) 0.5 (b) 0.25 (c) 0.4488 (d) 0.2244
Answers: 1
Mathematics, 22.06.2019 00:30, ERIKALYNN092502
The scatter plot shows the number of animal cells clara examined in a laboratory in different months: plot ordered pairs 1, 20 and 2, 60 and 3,100 and 4, 140 and 5, 180 what is the approximate predicted number of animal cells clara examined in the 9th month?
Answers: 3
Mathematics, 22.06.2019 00:30, brianlykid3042
Graph a point. start at your origin, move left 10 units, and then move up three units which ordered pair is the point you graphed
Answers: 2
You know the right answer?
Questions in other subjects:

Biology, 28.11.2021 01:00
Mathematics, 28.11.2021 01:00
Mathematics, 28.11.2021 01:00
Mathematics, 28.11.2021 01:00


Physics, 28.11.2021 01:00


