
Mathematics, 25.03.2021 19:30 Nakieapowell1276
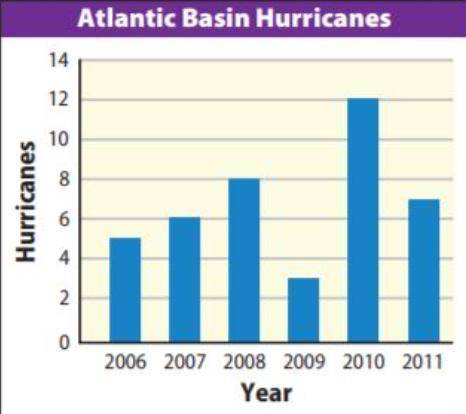
The bar graph at the left shows the number of hurricanes in the Atlantic Basin from 2006–2011.
a. Find the amount of change and the percent of decrease in the number of hurricanes from 2008 to 2009 and from 2010 to 2011. Compare the amounts of change and percent of decrease.
b. Between which two years were the percent of change the greatest? What was the percent of change during that period?

Answers: 1


Other questions on the subject: Mathematics
Mathematics, 21.06.2019 21:30, adam15200031
Yesterday, george drank 1 small bottle and 2 large bottles, for a total of 1,372 grams. the day before , he drank 1 small bottle and 1 large bottle, for the total of 858 grams. how many grams does each bottle hold?
Answers: 1
Mathematics, 21.06.2019 22:00, ashhleyjohnson
After a dreary day of rain, the sun peeks through the clouds and a rainbow forms. you notice the rainbow is the shape of a parabola. the equation for this parabola is y = -x2 + 36. graph of a parabola opening down at the vertex 0 comma 36 crossing the x–axis at negative 6 comma 0 and 6 comma 0. in the distance, an airplane is taking off. as it ascends during take-off, it makes a slanted line that cuts through the rainbow at two points. create a table of at least four values for the function that includes two points of intersection between the airplane and the rainbow. analyze the two functions. answer the following reflection questions in complete sentences. what is the domain and range of the rainbow? explain what the domain and range represent. do all of the values make sense in this situation? why or why not? what are the x- and y-intercepts of the rainbow? explain what each intercept represents. is the linear function you created with your table positive or negative? explain. what are the solutions or solution to the system of equations created? explain what it or they represent. create your own piecewise function with at least two functions. explain, using complete sentences, the steps for graphing the function. graph the function by hand or using a graphing software of your choice (remember to submit the graph).
Answers: 2
You know the right answer?
The bar graph at the left shows the number of hurricanes in the Atlantic Basin from 2006–2011.
a. F...
Questions in other subjects:


Social Studies, 22.06.2019 11:20

Biology, 22.06.2019 11:20


