Could someone help me ? <33 Lesson 1 Skills Practice
Scatterplots
Explain whether the scat...

Mathematics, 25.03.2021 19:00 jordonlewis
Could someone help me ? <33 Lesson 1 Skills Practice
Scatterplots
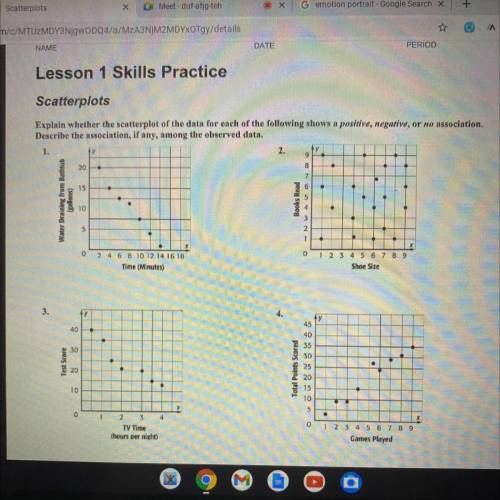
Explain whether the scatterplot of the data for each of the following shows a positive, negative, or no association.
Describe the association, if any, among the observed data.
1.
2. у
20
9
8
7
6
15
Water Draining from Bathtub
(suoje
Books Read
10
1
0
0
2 4 6 8 10 12 14 16 18
Time (Minutes)
1 2 3 4 5 6 7 8 9
Shoe Size
3.
У
45
40
30
Test Score
.
20
Total Points Scored
40
35
9 30
25
20
15
10
10
5
0

Answers: 1


Other questions on the subject: Mathematics
Mathematics, 21.06.2019 16:30, enchantednights
Look at attachment. has all info needed. need
Answers: 1
Mathematics, 21.06.2019 22:30, murdocksfamilyouoxvm
Adeposit of 5500 at 6% for 3 years equals
Answers: 2
Mathematics, 22.06.2019 01:10, MayFlowers
Is the response to the survey question "did you smoke in the last week question mark "response to the survey question "did you smoke in the last week? " a discrete random variable, a continuous random variable, or not a random variable?
Answers: 1
Mathematics, 22.06.2019 01:10, calmicaela12s
A3cm×3cm\greend{3\,\text{cm} \times 3\,\text{cm}} 3cm×3cm start color greend, 3, space, c, m, times, 3, space, c, m, end color greend rectangle sits inside a circle with radius of 4cm\blued{4\,\text{cm}} 4cm start color blued, 4, space, c, m, end color blued . what is the area of the shaded region? round your final answer to the nearest hundredth.
Answers: 3
You know the right answer?
Questions in other subjects:


Mathematics, 22.04.2020 04:49
Mathematics, 22.04.2020 04:49

Mathematics, 22.04.2020 04:50


