subject
Mathematics, 25.03.2021 18:10 anaalashay

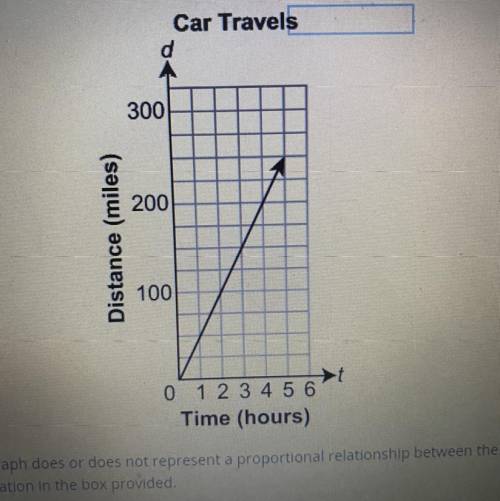
The graph shows the distance in miles, d, a car travels in hours. (a)
Car Travels
d
300
200
Distance (miles)
100
0 1 2 3 4 5 6
Time (hours)
Explain why the graph does or does not represent a proportional relationship between the variables d and t.
Enter your explanation in the box provided.


The graph shows the distance in miles, d, a car travels in hours.

(a)
Car Travels
d
300
200
Dista

ansver
Answers: 3

Other questions on the subject: Mathematics

image
Mathematics, 21.06.2019 15:30, samoc22
The table respent two linear functions the equation respented by the first tables is given
Answers: 2
image
Mathematics, 21.06.2019 17:00, zacksoccer8279
Me! last question, and i'm stuck! write the algebraic expression that models the word phrase. the product of 2 divided by the number h and 8 more than the number k
Answers: 1
image
Mathematics, 21.06.2019 18:20, laza87
Find the solution of this system of equation -7x+y=-20 9x-3y=36
Answers: 1
image
Mathematics, 21.06.2019 20:30, janwesley3
Select all expressions that are equivalent to 2(3x + 7y). question 1 options: 6x + 14y 6x + 7y 1(6x + 14y)
Answers: 1
You know the right answer?
The graph shows the distance in miles, d, a car travels in hours. (a)
Car Travels
d

Questions in other subjects:

Konu
English, 24.04.2021 02:10
Konu
English, 24.04.2021 02:10