
Mathematics, 25.03.2021 17:20 clarissa2006
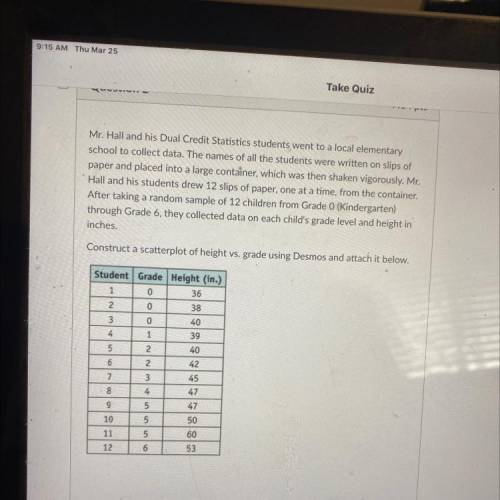
Mr. Hall and his Dual Credit Statistics students went to a local elementary
school to collect data. The names of all the students were written on slips of
paper and placed into a large container, which was then shaken vigorously. Mr.
Hall and his students drew 12 slips of paper, one at a time, from the container,
After taking a random sample of 12 children from Grade 0 (Kindergarten)
through Grade 6, they collected data on each child's grade level and height in
inches.
Construct a scatterplot of height vs, grade using Desmos and attach it below.
Student Grade Height (in.)
1
0
36
Ź 0
38
3
0
40
4
1
39
5
2
40
6
2
42
45
7
8
3
4
5
47
9
10
5
11
5
6
50
60
53
12

Answers: 1


Other questions on the subject: Mathematics
Mathematics, 21.06.2019 17:30, ricardodeleon152
As part of an annual fundraiser to raise money for diabetes research, diane joined a bikeathon. the track she biked on was 1,920 yards long. diane biked 38.5 laps. her sponsors agreed to donate an amount of money for each mile she biked. how many miles did she bike? first fill in the blanks on the left side using the ratios shown. then write your answer. given ratios: 5280ft / 1 mi , 1 mi /5280 ft , 1,920 yards / 1 lap , 1 lap / 1,920 yards , 3 ft / 1 yard , 1 yard / 3 ft. blanks: 38.5 laps / 1 yard x (blank) x (blank) x (blank) = (blank) miles i'm really confused on how to do this, and the explanations aren't exactly . if you could walk me through how to do this, it would be greatly appreciated.
Answers: 1
Mathematics, 21.06.2019 17:30, BreBreDoeCCx
If the class was going to get a class pet and 5 picked fish and 7 pick bird and 8 picked rabbits have many students were in the
Answers: 1
Mathematics, 21.06.2019 18:00, xxaurorabluexx
Suppose you are going to graph the data in the table. minutes temperature (°c) 0 -2 1 1 2 3 3 4 4 5 5 -4 6 2 7 -3 what data should be represented on each axis, and what should the axis increments be? x-axis: minutes in increments of 1; y-axis: temperature in increments of 5 x-axis: temperature in increments of 5; y-axis: minutes in increments of 1 x-axis: minutes in increments of 1; y-axis: temperature in increments of 1 x-axis: temperature in increments of 1; y-axis: minutes in increments of 5
Answers: 2
You know the right answer?
Mr. Hall and his Dual Credit Statistics students went to a local elementary
school to collect data....
Questions in other subjects:
Mathematics, 28.03.2020 00:13
Mathematics, 28.03.2020 00:13

Physics, 28.03.2020 00:13


Mathematics, 28.03.2020 00:13
Mathematics, 28.03.2020 00:13
History, 28.03.2020 00:13


