
Mathematics, 25.03.2021 07:10 jdkrisdaimcc11
SOMEONE PLEASE HELP...
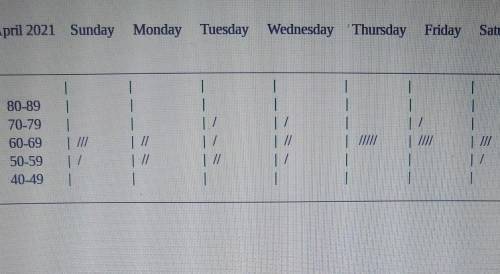
I. Construct a chart like the sample in the discussion. Try to have no fewer than five class intervals. "Class interval" refers to the number of categories a type of data could fall into (e. g., 70-79 degrees, 80-89 degrees, etc.).
II. Compute the probability that an observation picked at random will be a Saturday observation.
III. Repeat number two for the remaining days of the week.
IV. Use the chart in the discussion to answer these questions: a. What is the probability a day in the 70s is a Monday? b. Which set forms the intersection of Tuesdays in the 80s? c. What is the probability an observation picked at random is both a Sunday and more than 90 degrees?
V. Construct a histogram to display the temperature frequencies for the month. (Use temperature class intervals and totals.)
VI. Pretend that you are working for the tourist bureau for your city. Which measure of central tendency (mean, median, mode) would you use in advertising to attract tourists. Justify your answer.

Answers: 2


Other questions on the subject: Mathematics
Mathematics, 21.06.2019 18:30, Trinityslater
It says factor each expression completely 8y+48
Answers: 1
Mathematics, 21.06.2019 18:30, budjasdatazaki467
Let f(x) = 3 − x . find the average rate of change of f(x) from x = a to x = a + h and simplify your answer so that no single factor of h is left in the denominator.
Answers: 1
Mathematics, 22.06.2019 00:30, amandapill
What is the area of the parallelogram? 48 sqrt(3)cm2 48 cm2 24 sqrt (3) cm2 24 cm2
Answers: 2
You know the right answer?
SOMEONE PLEASE HELP...
I. Construct a chart like the sample in the discussion. Try to have no fewer...
Questions in other subjects:
Mathematics, 03.09.2020 17:01

Biology, 03.09.2020 17:01
Mathematics, 03.09.2020 17:01

History, 03.09.2020 17:01

History, 03.09.2020 17:01
English, 03.09.2020 17:01

Physics, 03.09.2020 17:01


