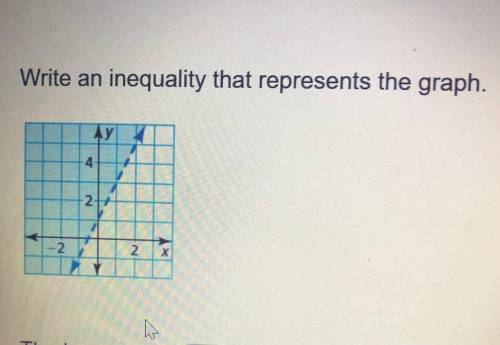
Write the inequality that represents the graph.
would be best if you could explain! ^^
<...

Mathematics, 25.03.2021 04:30 kingjames82
Write the inequality that represents the graph.
would be best if you could explain! ^^

Answers: 3


Other questions on the subject: Mathematics
Mathematics, 21.06.2019 23:40, yarrito20011307
20 ! jason orders a data set from least to greatest. complete the sentence by selecting the correct word from each drop-down menu. the middle value of the data set is a measure and is called the part a: center b: spread part b: mean a: mean absolute deviation b: median c: range
Answers: 1
Mathematics, 22.06.2019 01:40, tinamarie04ts
Agroup of student volunteers participates in a study designed to assess several behavioral interventions for improving output in a repetitive task. prior to the beginning of the study, all volunteers unknowingly observed, and their output is measured. at the beginning of the study, prior to any intervention, the volunteers perform the same task under the observation of a study administrator, and their overall output increases. which of the following terms describes this phenomenon? a. simpson's paradox b. hawthorne effect are d. novelty effect d. pygmalion effect e. observer-expectancy effect
Answers: 1
Mathematics, 22.06.2019 02:20, LillySchool6529
Stu and ambrose are working together on a study of whether diet is related to students' mental health. first, they randomly select 10 students from the student center and 10 students from the office of counseling and psychological services. then, they ask students to rate their diet in terms of healthiness on a scale of 1-100 before completing a 20-item mental health survey. a) name one of the constructs being studied b) how was the construct you named above operationally defined in this experiment? e) was the variable you described above their independent variable, their dependent variable, or a controlled variable? d) what is a confounding variable? what is a potential confound in this study?
Answers: 3
You know the right answer?
Questions in other subjects:


Engineering, 01.03.2021 20:00

Spanish, 01.03.2021 20:00


Biology, 01.03.2021 20:00
Mathematics, 01.03.2021 20:00


