17
Do not writo
outside the
box
8
Here is some data about the people listening...

Mathematics, 25.03.2021 01:00 twistedhyperboles
17
Do not writo
outside the
box
8
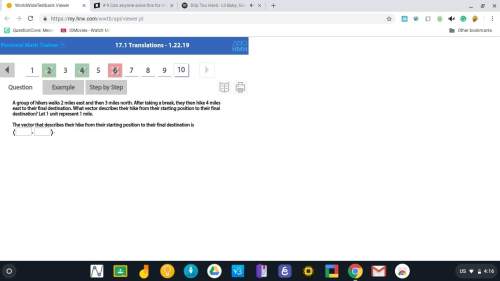
Here is some data about the people listening to a radio station one day.
Percentage
Mean number of
hours listening
Range of
number of
hours listening
4.5
1.2
21
Aged 40 or under
13.9
6.3
79
Aged 41 or over
Compare the data for people aged 40 or under with the data for people aged 41 or over.
Make three comparisons.
[3 marks]
Comparison 1
Comparison 2

Answers: 1


Other questions on the subject: Mathematics
Mathematics, 21.06.2019 20:00, JOEFRESH10
The table shows the age and finish time of ten runners in a half marathon. identify the outlier in this data set. drag into the table the ordered pair of the outlier and a reason why that point is an outlier.
Answers: 1
Mathematics, 22.06.2019 00:00, lindsaynielsen13
Astocks price gained 3% in april and 5% in may and then lost 4% in june and 1% in july during which month did the stocks price change the most
Answers: 1
You know the right answer?
Questions in other subjects:


History, 11.07.2019 23:30
Mathematics, 11.07.2019 23:30
Mathematics, 11.07.2019 23:30
Mathematics, 11.07.2019 23:30


