
Mathematics, 24.03.2021 22:20 nani122
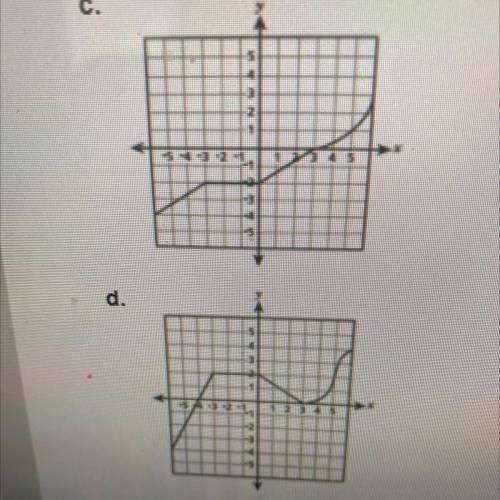
A function has the following properties
. It is increasing and linear when the value of x is between -5 and -3.
. It remains constant when the value of x is between -3 and 0
. It is decreasing and linear when the value of x is between 0 and 3
. It is increasing and nonlinear when the value of x is between 3 and 5
Which graph best represents this function?

Answers: 2


Other questions on the subject: Mathematics
Mathematics, 21.06.2019 20:00, claudia3776
What does the sign of the slope tell you about a line?
Answers: 2
Mathematics, 22.06.2019 01:30, maymuu4life
As a self-employed seamstress, you know that it takes 7 yards of material to make 3 jackets. you bought 15 yards of material to make 7 jackets. did you buy enough material? if not, how much were you over or under?
Answers: 1
You know the right answer?
A function has the following properties
. It is increasing and linear when the value of x is betwee...
Questions in other subjects:
Mathematics, 05.05.2020 23:44


English, 05.05.2020 23:44


