The table is the distribution of years of schooling for
children age 11 and younger.
0 1 2 3<...

Mathematics, 24.03.2021 21:40 rizha55
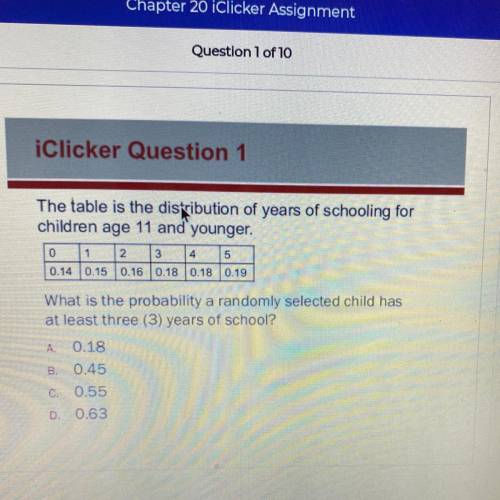
The table is the distribution of years of schooling for
children age 11 and younger.
0 1 2 3
5
0.14 0.15 0.16 0.18 0.18 0.19
4
A
What is the probability a randomly selected child has
at least three (3) years of school?
0.18
B. 0.45
C. 0.55
D. 0.63

Answers: 1


Other questions on the subject: Mathematics
Mathematics, 21.06.2019 19:00, mbalderp5bxjo
Billy plotted −3 4 and −1 4 on a number line to determine that −3 4 is smaller than −1 4 is he correct? explain why or why not?
Answers: 3
You know the right answer?
Questions in other subjects:

Arts, 24.03.2021 17:00


Mathematics, 24.03.2021 17:00

Computers and Technology, 24.03.2021 17:00
History, 24.03.2021 17:00


