Mathematics, 24.03.2021 14:10 Hosanna130
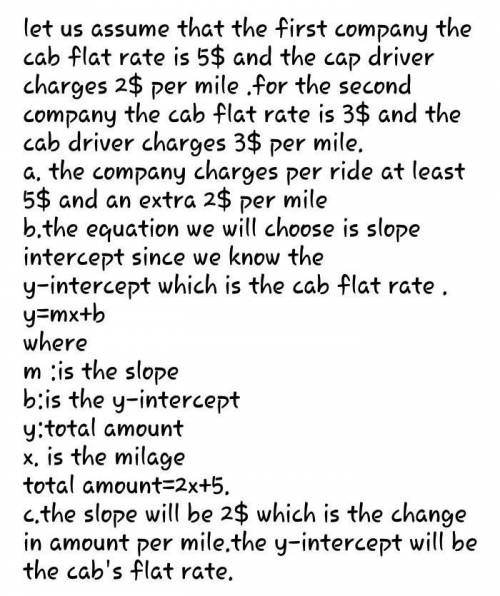
Linear Functions Unit Portfolio Directions: Complete each of the tasks outlined below. Cab companies often charge a flat fee for picking someone up and then charge an additional fee per mile driven. Pick a U. S. city and research the rates of two different cab companies in that city. Find companies that charge different amounts per mile and have different flat fees. If you have trouble finding this information for two companies, you can make up what you think would be reasonable prices for a cab's flat rate and a cab's rate per mile. Task 1 a. For the first company, express in words the amount the cab company charges per ride and per mile. b. Write an equation in slope-intercept, point-slope, or standard form. Explain why you chose the form you did. C. What do the slope and y-intercept mean in the context of this problem? Hint: What do you pay when you step into the cab? Task 2 For the second company, express in a table the cost of the cab ride given the number of miles provided. A. Write and equation in slope-intercept, point-slope, or standard form. Explain why you chose the form you did. B. What does the slope mean in the context of the problem? Task 3 Cabs use a valuable commodity—gas! Research average gas prices from 2005-2015 for the city you chose. If you can't find this information for your specific city, you can research national gas price averages instead. A. Create a table showing the average gas price each year. B. Create a scatter plot of the data in your table. C. What equation models the data? What are the domain and range of the equation? Do you think your equation is a good fit for the data? Explain how you determined your answers. D. Is there a trend in the data? Does there seem to be a positive correlation, a negative correlation, or neither? How much do you expect gas to cost in 2020? Explain.

Answers: 3


Other questions on the subject: Mathematics

Mathematics, 21.06.2019 20:30, 20calzoy
Venita is sewing new curtains. the table below shows the relationship between the number of stitches in a row and the length ofthe row. sewingnumber of stitches length (cm)51 131532024306what is the relationship between the number of stitches and the length? othe number of stitches istimes the length. o. the number of stitches is 3 times the length.
Answers: 2

Mathematics, 21.06.2019 23:30, johnlumpkin5183
Determine if the following statement is true or false. the normal curve is symmetric about its​ mean, mu. choose the best answer below. a. the statement is false. the normal curve is not symmetric about its​ mean, because the mean is the balancing point of the graph of the distribution. the median is the point where​ 50% of the area under the distribution is to the left and​ 50% to the right.​ therefore, the normal curve could only be symmetric about its​ median, not about its mean. b. the statement is true. the normal curve is a symmetric distribution with one​ peak, which means the​ mean, median, and mode are all equal.​ therefore, the normal curve is symmetric about the​ mean, mu. c. the statement is false. the mean is the balancing point for the graph of a​ distribution, and​ therefore, it is impossible for any distribution to be symmetric about the mean. d. the statement is true. the mean is the balancing point for the graph of a​ distribution, and​ therefore, all distributions are symmetric about the mean.
Answers: 2

Mathematics, 22.06.2019 00:30, aidenbender06
What are the greatest common factor of 75 and 30
Answers: 2
You know the right answer?
Linear Functions Unit Portfolio Directions: Complete each of the tasks outlined below. Cab companies...
Questions in other subjects:

English, 05.01.2021 01:30

Mathematics, 05.01.2021 01:30

Spanish, 05.01.2021 01:30

Mathematics, 05.01.2021 01:30

History, 05.01.2021 01:30


History, 05.01.2021 01:30

English, 05.01.2021 01:30

Social Studies, 05.01.2021 01:30


