
Mathematics, 24.03.2021 02:10 reeeg38
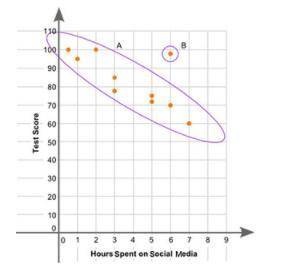
The scatter plot shows the relationship between the test scores of a group of students and the number of hours they spend on social media in a week:
A scatter plot is shown. The x-axis is labeled Hours spent on social media, and the y-axis is labeled test score. Data points are located at 0.5 and 100, 2 and 100, 1 and 95, 3 and 85, 3 and 78, 5 and 75, 5 and 72, 6 and 70, 6 and 98, 7 and 60. A circle labeled A includes all of the points except for the one at 6 and 98. Point 6 and 98 is labled B.
Part A: What is the group of points labeled A called? What is the point labeled B called? Give a possible reason for the presence of point B. (3 points)
Part B: Describe the association between a student's test scores and the number of hours spent on social media. (2 points)

Answers: 2


Other questions on the subject: Mathematics
Mathematics, 21.06.2019 20:00, ghlin96
Axel follows these steps to divide 40 by 9: start with 40. 1. divide by 9 and write down the remainder. 2. write a zero after the remainder. 3. repeat steps 1 and 2 until you have a remainder of zero. examine his work, and then complete the statements below.
Answers: 1
Mathematics, 22.06.2019 00:30, ashled7789
Which number can each term of the equation be multiplied by to eliminate the decimals before solving? 5.6j- 0.12=4+1.1j
Answers: 3
You know the right answer?
The scatter plot shows the relationship between the test scores of a group of students and the numbe...
Questions in other subjects:


English, 25.03.2021 01:00
Mathematics, 25.03.2021 01:00
Mathematics, 25.03.2021 01:00

Mathematics, 25.03.2021 01:00
Mathematics, 25.03.2021 01:00


