
Mathematics, 23.03.2021 21:20 mckeeshallea400
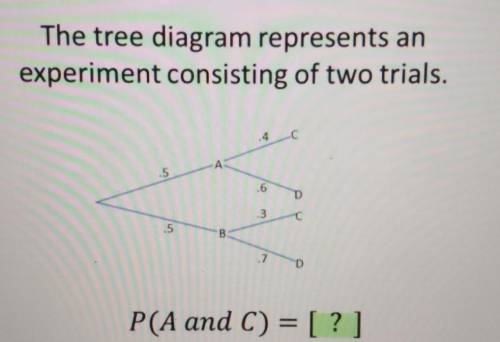
The tree diagram represents an experiment consisting of two trials. .4 -C С A .5 .6 D 3 с .5 B .7 D P(A and C) = [?] please help so confused

Answers: 1


Other questions on the subject: Mathematics
Mathematics, 21.06.2019 12:50, dbn4everloved
What is the equation of the linear function represented by the table?
Answers: 1
Mathematics, 21.06.2019 17:30, tristan4233
Noor brought 21 sheets of stickers. she gave 1/3 of a sheet to each of the 45 students at recess. she wants to give teachers 1 1/2 sheets each.
Answers: 2
Mathematics, 21.06.2019 21:00, ShahinF7536
Graph the equationy=x^2 -[tex]y = x^{2} - 2[/tex]
Answers: 1
You know the right answer?
The tree diagram represents an experiment consisting of two trials. .4 -C С A .5 .6 D 3 с .5 B .7 D...
Questions in other subjects:


Biology, 27.06.2019 06:10

Mathematics, 27.06.2019 06:10


