HELP ASAPPP! ILL GIVE BRAINLIEST
PART 2 IS IN COMMENTS
Since Spring started, Kareem h...

Mathematics, 23.03.2021 18:20 ginapogones4958
HELP ASAPPP! ILL GIVE BRAINLIEST
PART 2 IS IN COMMENTS
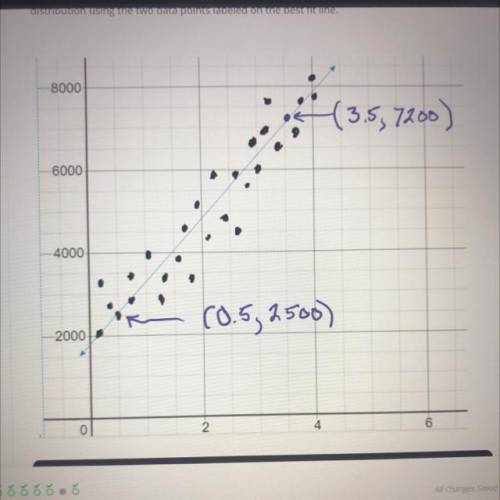
Since Spring started, Kareem has been surveying the growth of leaves on his neighbor-
hood trees. He goes out every day and computes the average number of leaves on a
sample of trees. He created a scatter plot where the y-axis represents the average number
of leaves on the trees, and the x-axis represents the number of weeks since Spring started.
Write a linear equation in slope-intercept form that can be used to approximate the data
distribution using the two data points labeled on the best fit line.

Answers: 2


Other questions on the subject: Mathematics
Mathematics, 21.06.2019 18:00, winterblanco
On saturday a souvenir shop had 125 customers. sixty four percent of the costumers paid with a credit card. how many costumers paid with cash?
Answers: 1
Mathematics, 21.06.2019 22:00, zurfluhe
Manuela claims that and are congruent. which statement best describes her claim? she is incorrect because the segments do not have the same orientation. she is incorrect because the segments do not have the same length. she is correct because the segments have the same length. she is correct because the segments have the same orientation.
Answers: 1
Mathematics, 22.06.2019 02:20, jdkrisdaimcc11
The students at jefferson middle school are raising money for a charity by selling t-shirts and hats. the number of t-shirts sold was 3 times the number of hats. the profit was $5 for each t-shirt sold and $2.50 for each hat sold. the students raised $840 for the charity. they used the system below to analyze their success and found the solution to be (144, 48). 5x+2.50y=840 x=3y how much did they earn from t-shirt sales?
Answers: 2
Mathematics, 22.06.2019 02:30, misk980
Atrain traveled for 1.5 hours to the first station, stopped for 30 minutes, then traveled for 4 hours to the final station where it stopped for 1 hour. the total distance traveled is a function of time. which graph most accurately represents this scenario? a graph is shown with the x-axis labeled time (in hours) and the y-axis labeled total distance (in miles). the line begins at the origin and moves upward for 1.5 hours. the line then continues upward at a slow rate until 2 hours. from 2 to 6 hours, the line continues quickly upward. from 6 to 7 hours, it moves downward until it touches the x-axis a graph is shown with the axis labeled time (in hours) and the y axis labeled total distance (in miles). a line is shown beginning at the origin. the line moves upward until 1.5 hours, then is a horizontal line until 2 hours. the line moves quickly upward again until 6 hours, and then is horizontal until 7 hours a graph is shown with the axis labeled time (in hours) and the y-axis labeled total distance (in miles). the line begins at the y-axis where y equals 125. it is horizontal until 1.5 hours, then moves downward until 2 hours where it touches the x-axis. the line moves upward until 6 hours and then moves downward until 7 hours where it touches the x-axis a graph is shown with the axis labeled time (in hours) and the y-axis labeled total distance (in miles). the line begins at y equals 125 and is horizontal for 1.5 hours. the line moves downward until 2 hours, then back up until 5.5 hours. the line is horizontal from 5.5 to 7 hours
Answers: 1
You know the right answer?
Questions in other subjects:

History, 31.03.2021 02:00
History, 31.03.2021 02:00

Physics, 31.03.2021 02:00
Mathematics, 31.03.2021 02:00
Mathematics, 31.03.2021 02:00


