
Mathematics, 23.03.2021 06:50 18alewis
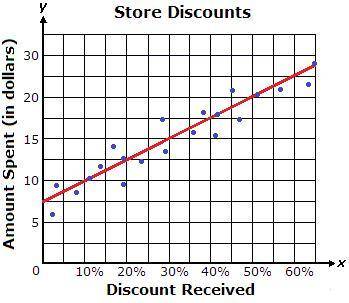
The graph below shows a line of best fit for data collected on the amount customers spent in relation to the discount they received. The equation of the line of best fit is y = 25x + 7.5. What does the y-intercept represent?
A.
the discount per item
B.
the number of items purchased
C.
the discount received by a customer who did not make a purchase
D.
the amount spent by a customer who did not receive a discount

Answers: 1


Other questions on the subject: Mathematics
Mathematics, 21.06.2019 17:20, garciavergaraana
Which of these equations, when solved, gives a different value of x than the other three? a9.1 = -0.2x + 10 b10 = 9.1 + 0.2x c10 – 0.2x = 9.1 d9.1 – 10 = 0.2x
Answers: 1
Mathematics, 21.06.2019 19:30, abigailstolp
Find the domain of the following expression: 1/(√x)-2
Answers: 1
Mathematics, 21.06.2019 22:00, stalley1521
How many solutions does the nonlinear system of equations graphed below have? a. one b. zero c. four d. two
Answers: 2
Mathematics, 22.06.2019 00:30, bobby237065
Three friends are comparing the prices of various packages of golf balls at a sporting goods store. hector finds a package of 6 golf balls that costs $4.50.
Answers: 3
You know the right answer?
The graph below shows a line of best fit for data collected on the amount customers spent in relatio...
Questions in other subjects:
Mathematics, 19.05.2021 23:30

Mathematics, 19.05.2021 23:30

Mathematics, 19.05.2021 23:30
Mathematics, 19.05.2021 23:30

Mathematics, 19.05.2021 23:30


