
Mathematics, 22.03.2021 22:40 Reagan650
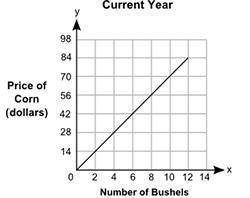
The graph shows the prices of different numbers of bushels of corn at a store in the current year. The table shows the prices of different numbers of bushels of corn at the same store in the previous year.
Table:
Previous Year
Number of Bushels
Price of Corn (dollars)
2
10
4
20
6
30
8
40
Part A: Describe in words how you can find the rate of change of a bushel of corn in the current year, and find the value. (5 points)
Part B: How many dollars more is the price of a bushel of corn in the current year than the price of a bushel of corn in the previous year? Show your work. (5 points)

Answers: 1


Other questions on the subject: Mathematics
Mathematics, 21.06.2019 22:10, ansonferns983
Given: ae ≅ ce ; de ≅ be prove: abcd is a parallelogram. we have that ab || dc. by a similar argument used to prove that △aeb ≅ △ced, we can show that △ ≅ △ceb by. so, ∠cad ≅ ∠ by cpctc. therefore, ad || bc by the converse of the theorem. since both pair of opposite sides are parallel, quadrilateral abcd is a parallelogram.
Answers: 1
Mathematics, 21.06.2019 22:30, jaydenrenee111902
The volume of the sun is approximately 1 × 10^18 cu km, while the volume of jupiter is approximately 1 × 10^15 cu km. which of the following is true? a. the volume of jupiter is approximately one thousand times the volume of the sun. b. the volume of jupiter is approximately one hundred times the volume of the sun. c. the volume of the sun is approximately one thousand times the volume of jupiter. d. the volume of the sun is approximately one hundred times the volume of jupiter.
Answers: 2
Mathematics, 21.06.2019 23:30, reycaden
The number of members f(x) in a local swimming club increased by 30% every year over a period of x years. the function below shows the relationship between f(x) and x: f(x) = 10(1.3)xwhich of the following graphs best represents the function? graph of f of x equals 1.3 multiplied by 10 to the power of x graph of exponential function going up from left to right in quadrant 1 through the point 0, 0 and continuing towards infinity graph of f of x equals 10 multiplied by 1.3 to the power of x graph of f of x equals 1.3 to the power of x
Answers: 1
You know the right answer?
The graph shows the prices of different numbers of bushels of corn at a store in the current year. T...
Questions in other subjects:
Mathematics, 20.09.2019 11:50
Mathematics, 20.09.2019 11:50

Computers and Technology, 20.09.2019 11:50

History, 20.09.2019 11:50
Mathematics, 20.09.2019 11:50

Physics, 20.09.2019 11:50

Spanish, 20.09.2019 11:50
Mathematics, 20.09.2019 11:50


