
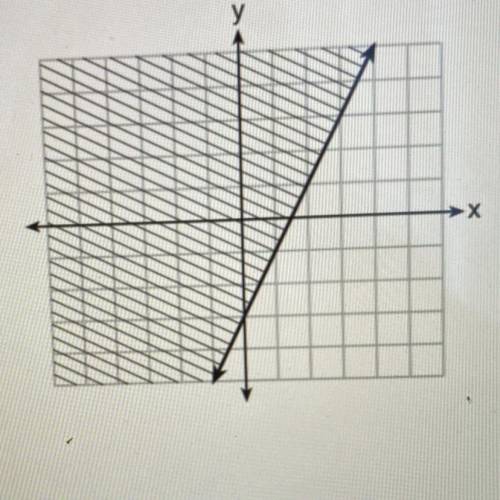
Which inequality is represented by the graph below? O y < 2x - 3
Oy > 2x - 3
Oy<-3x...

Mathematics, 22.03.2021 19:50 dnjames01
Which inequality is represented by the graph below? O y < 2x - 3
Oy > 2x - 3
Oy<-3x + 2
Oy> -3x + 2

Answers: 1


Other questions on the subject: Mathematics
Mathematics, 20.06.2019 18:04, caprisun1491
Valentino starts with a population of 1,500 amoebas that increases 35% in size every hour for a number of hours, h. the expression 1,500(1+0.35)h finds the number of amoebas after h hours. which statement about this expression is true? a. it is the initial population raised to the growth factor after h hours. b. it is the sum of the initial population and the percent increase. c. it is the sum of the initial population and the growth factor after h hours. d. it is the product of the initial population and the growth factor after h hours.
Answers: 2
Mathematics, 21.06.2019 21:50, lilybrok04
(x-5)1/2+5=2 what is possible solution of this equation
Answers: 1
You know the right answer?
Questions in other subjects:

English, 26.09.2019 21:30

Biology, 26.09.2019 21:30


Social Studies, 26.09.2019 21:30

Chemistry, 26.09.2019 21:30


