
Mathematics, 22.03.2021 19:10 jadielmatmat
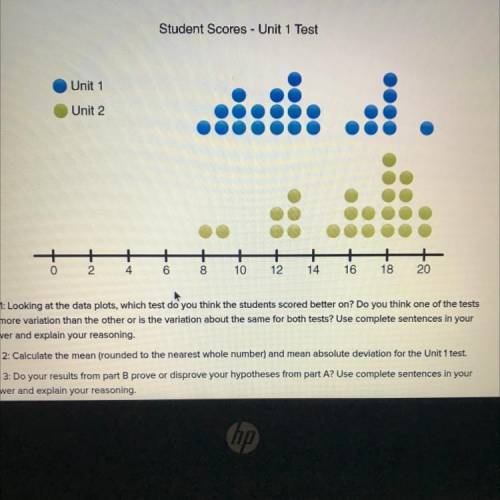
Part Looking at the data plots, which test do you think the students scored better on? Do you think one of the tests
has more variation than the other or is the variation about the same for both tests? Use complete sentences in your
answer and explain your reasoning,
Part 2: Calculate the mean (rounded to the nearest whole numbers and mean absolute deviation for the Unit 1 test
Part 3: Do your results from part B prove or disprove your hypotheses from part A? Use complete sentences in your
answer and explain your reasoning.

Answers: 1


Other questions on the subject: Mathematics
Mathematics, 21.06.2019 14:00, hockeykid7583
The axis of symmetry for the graph of the function f(x)=1/4^2+bx +10 is x=6. what is the value of b?
Answers: 1
Mathematics, 21.06.2019 15:00, payshencec21
Find the balance at the end of 4 years if 1000 is deposited at the rate of
Answers: 2
Mathematics, 21.06.2019 18:00, leomessifanboy678
Ateacher noticed 5/8 of the students were wearing either blue shorts or white shorts. write two different ways this could be done.
Answers: 2
Mathematics, 21.06.2019 19:40, ashley24109
The weights of broilers (commercially raised chickens) are approximately normally distributed with mean 1387 grams and standard deviation 161 grams. what is the probability that a randomly selected broiler weighs more than 1,425 grams?
Answers: 2
You know the right answer?
Part Looking at the data plots, which test do you think the students scored better on? Do you think...
Questions in other subjects:
Mathematics, 05.11.2020 05:30


Mathematics, 05.11.2020 05:30


Biology, 05.11.2020 05:30

Chemistry, 05.11.2020 05:30


