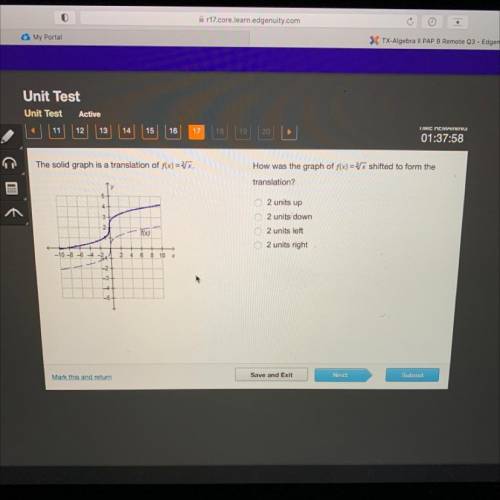
How was the graph of f(x) = 3Vx shifted to form the
translation?
...

Mathematics, 22.03.2021 19:30 lyric2714
How was the graph of f(x) = 3Vx shifted to form the
translation?

Answers: 2


Other questions on the subject: Mathematics
Mathematics, 21.06.2019 19:30, jrassicworld4ever
Need now max recorded the heights of 500 male humans. he found that the heights were normally distributed around a mean of 177 centimeters. which statements about max’s data must be true? a) the median of max’s data is 250 b) more than half of the data points max recorded were 177 centimeters. c) a data point chosen at random is as likely to be above the mean as it is to be below the mean. d) every height within three standard deviations of the mean is equally likely to be chosen if a data point is selected at random.
Answers: 1
Mathematics, 21.06.2019 21:10, ttrinityelyse17
The table below shows the approximate height of an object x seconds after the object was dropped. the function h(x)= -16x^2 +100 models the data in the table. for which value of x would this model make it the least sense to use? a. -2.75 b. 0.25 c. 1.75 d. 2.25
Answers: 2
Mathematics, 21.06.2019 22:30, campilk5
Sketch the vector field vector f( vector r ) = 8vector r in the xy-plane. select all that apply. the length of each vector is 8. the lengths of the vectors decrease as you move away from the origin. all the vectors point away from the origin. all the vectors point in the same direction. all the vectors point towards the origin. the lengths of the vectors increase as you move away from the origin.
Answers: 2
Mathematics, 21.06.2019 22:30, Elenegoggg
Which of the following graphs could represent a quartic function?
Answers: 1
You know the right answer?
Questions in other subjects:


Biology, 10.05.2021 22:10
Mathematics, 10.05.2021 22:10


