
Mathematics, 22.03.2021 18:10 christine44gordon
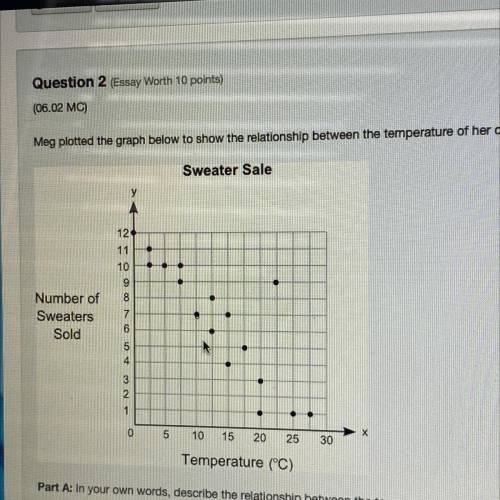
Meg plotted the graph below to show the relationship between the temperature of her city and the number of sweaters sold at a store:
Sweater Sale
Number of
Sweaters
Sold
12
11
10
9
8
7
6
5
4
3
2
1
0 5 10 15 20 25 30
Temperature (°C)
Part A: In your own words, describe the relationship between the temperature of the city and the sale of sweaters in the city (5 points)
Part B: Describe how you can make the line of best fit. Write the approximate slope and y-intercept of the line of best fit. Show your work, including the points that you use to
calculate slope and y-Intercept. (5 points)

Answers: 3


Other questions on the subject: Mathematics
Mathematics, 21.06.2019 16:30, victoria8281
Answer the following for 896.31 cm= km 100cm = 1m 1000m = 1km a) 0.0089631 b) 0.0089631 c) 8.9631 d) 89.631
Answers: 1
Mathematics, 21.06.2019 21:00, lollollollollol1
What is the missing statement in step 4? ? rts ? ? vtu and ? rtu ? ? vts ? rts ? ? rvs and ? rtu ? ? stv ? vrs ? ? vru and ? usr ? ? usv ? vur ? ? vus and ? uvs ? ? sru
Answers: 3
Mathematics, 22.06.2019 00:30, Jazzy4real
Jaxon has s packs of 8 crazy straws. he divided the crazy straws into 2 equal bags. now, he has 224 crazy straws in each bag. how many packs of crazy straws did jaxon start with?
Answers: 1
You know the right answer?
Meg plotted the graph below to show the relationship between the temperature of her city and the num...
Questions in other subjects:

Biology, 24.05.2020 00:06

History, 24.05.2020 00:06


Business, 24.05.2020 00:06


