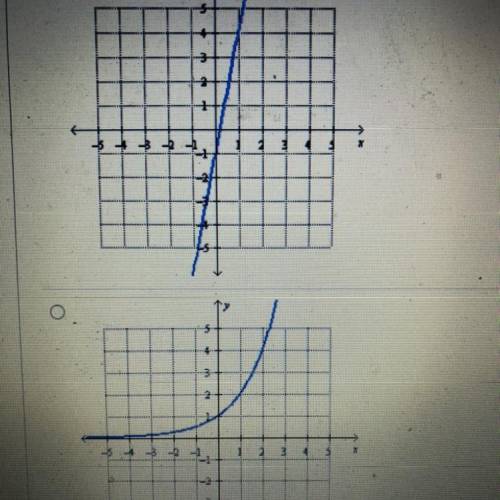
Which graph below represents exponential decay
...

Mathematics, 19.03.2021 23:30 fheight01
Which graph below represents exponential decay

Answers: 2


Other questions on the subject: Mathematics
Mathematics, 21.06.2019 15:00, Lizzyloves8910
Answer this question! 30 points and brainliest!
Answers: 1
Mathematics, 21.06.2019 22:00, kristineford198
What value is a discontinuity of x squared plus 8 x plus 4, all over x squared minus x minus 6?
Answers: 2
You know the right answer?
Questions in other subjects:

History, 05.02.2020 06:54


Mathematics, 05.02.2020 06:54
Mathematics, 05.02.2020 06:54
Mathematics, 05.02.2020 06:54


