
Mathematics, 19.03.2021 22:10 Flowershere121
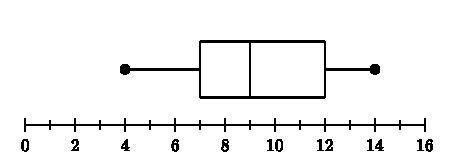
Which data set could be represented by the box plot shown below?
444, 555, 555, 777, 777, 101010, 101010, 111111, 131313, 131313, 131313, 141414
(Choice B)
B
444, 555, 777, 777, 777, 888, 101010, 111111, 111111, 131313, 131313, 141414
(Choice C)
C
444, 555, 555, 777, 777, 888, 999, 999, 111111, 111111, 131313, 141414
(Choice D)
D
222, 555, 777, 777, 777, 888, 101010, 111111, 111111, 131313, 131313, 1414

Answers: 3


Other questions on the subject: Mathematics
Mathematics, 21.06.2019 19:30, ginocousins06
Fa bus driver leaves her first stop by 7: 00 a. m., her route will take less than 37 minutes. if she leaves after 7: 00 a. m., she estimates that the same route will take no less than 42 minutes. which inequality represents the time it takes to drive the route, r?
Answers: 3
Mathematics, 22.06.2019 00:30, winterblanco
1/2+1/6-3/4 simplify the given expression leaving the answer in improper fraction form.
Answers: 2
Mathematics, 22.06.2019 01:20, ramenbowlz
Do one of the following, as appropriate: (a) find the critical value z subscript alpha divided by 2 , (b) find the critical value t subscript alpha divided by 2 . 99%; nequals 17; sigma is unknown; population appears to be normally distributed.
Answers: 3
Mathematics, 22.06.2019 02:00, ehaynie
Brittany has designed four different birdcages, each with the same volume: a square pyramid, a cylinder, a cone, and a sphere. the zoo wants to use one of brittany’s designs but plans to change the volume of the cage. find the design change that would result in the birdcage with the greatest volume. a.) increase the area of the base of the square pyramid by a factor of ten. b.) increase the height of the cylinder by a factor of ten. c.) increase the radius of the cone by a factor of ten. d.) increase the radius of a sphere by a factor of ten.
Answers: 1
You know the right answer?
Which data set could be represented by the box plot shown below?
444, 555, 555, 777, 777, 101010, 1...
Questions in other subjects:
Mathematics, 25.11.2021 07:00


Mathematics, 25.11.2021 07:00


