
Mathematics, 19.03.2021 18:50 bfgnnnbddf6830
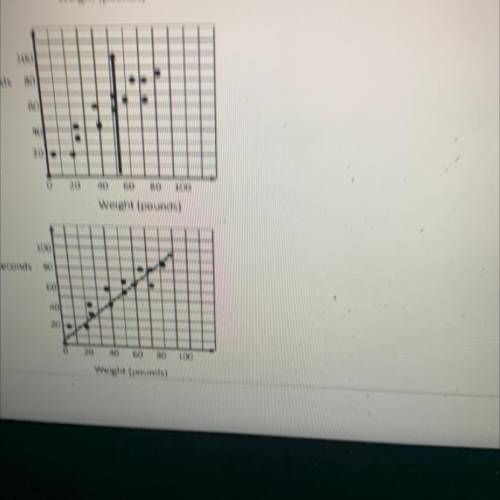
The graph shows the weight of dogs and the time it took the same dogs to complete an agility course in seconds. Which shows the line of best fit for the data

Answers: 1


Other questions on the subject: Mathematics
Mathematics, 21.06.2019 23:00, bravooyessenia
Mr. rose asked his students to draw a quadrilateral with 4 unequal sides. draw an example of this kind of quadrilateral.
Answers: 2
You know the right answer?
The graph shows the weight of dogs and the time it took the same dogs to complete an agility course...
Questions in other subjects:


Mathematics, 23.06.2019 18:50
Mathematics, 23.06.2019 18:50
Mathematics, 23.06.2019 18:50
English, 23.06.2019 18:50


