
Mathematics, 19.03.2021 18:20 simmy6
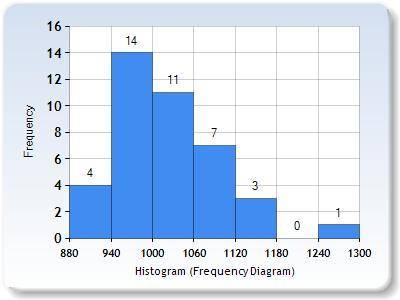
The following data represent the number of housing starts predicted for the 2nd quarter (April through June) of 2014 for a random sample of 40 economists.
984 1260 1009 992 975 993 1025 1164 1060
992 1100 942 1050 1047 1000 938 1035 1030
964 970 1061 1067 1100 1095 976 1012 1038
929 920 996 990 1095 1178 1017 980 1125
964 888 946 1004
Required:
a. Draw a histogram of the data.
b. Construct a 95 % confidence interval for the population mean forecast of the number of housing starts in the second quarter of 2014.
c. Construct a 90% confidence interval for the population mean forecast of the number of housing starts in the second quarter of 2014

Answers: 1


Other questions on the subject: Mathematics
Mathematics, 21.06.2019 16:30, nockturnal1993
Acarnival sold tickets for $1.50 for adults and $1.00 for students. there were 54 tickets sold for a total of $70.50. write a system of equations to represent the number of adult tickets, x, and the number of student tickets, y. find the solution and explain what it means. i'll you if you me
Answers: 1
Mathematics, 21.06.2019 20:00, alisonlebron15
An investment decreases in value by 30% in the first year and decreases by 40% in the second year. what is the percent decrease in percentage in the investment after two years
Answers: 1
You know the right answer?
The following data represent the number of housing starts predicted for the 2nd quarter (April throu...
Questions in other subjects:


English, 10.03.2020 09:01


English, 10.03.2020 09:01


