What is the range of the data shown on the stem-and-leaf plot?
Stems Leaves
4 36679
5 0...

Mathematics, 19.03.2021 18:30 oliviaclerk5
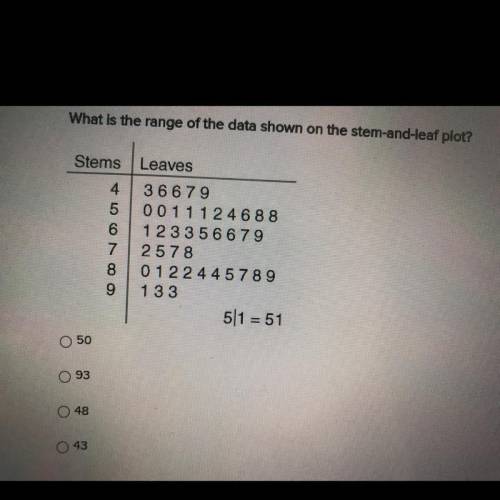
What is the range of the data shown on the stem-and-leaf plot?
Stems Leaves
4 36679
5 00111246 88
6 123 356 679
7 2578
8 0 1 2 2 4 4 5 7 8 9
9 133
5I1 = 51
50
93
48
43

Answers: 3


Other questions on the subject: Mathematics
Mathematics, 21.06.2019 14:30, robert7248
Click on the graphic until you find the right quotient. (36xa - 30xb) ÷ (-6x2)
Answers: 3
Mathematics, 21.06.2019 17:30, amiechap12
Let f(x) = x+3 and g(x) = 1/x the graph of (fog)(x) is shown below what is the range of (fog)(x)?
Answers: 2
Mathematics, 21.06.2019 18:30, kamiyaharris1
How to use order of operation in 20 divide by 4 multiply 5 = 1
Answers: 1
You know the right answer?
Questions in other subjects:

History, 24.07.2019 22:50

History, 24.07.2019 22:50
English, 24.07.2019 22:50

Social Studies, 24.07.2019 22:50
Mathematics, 24.07.2019 22:50
Mathematics, 24.07.2019 22:50


