10
8
6
Distance (mi)
4
2.
o
20 30 40 50
Time (min)
...

Mathematics, 18.03.2021 19:40 juliopejfuhrf5447
10
8
6
Distance (mi)
4
2.
o
20 30 40 50
Time (min)
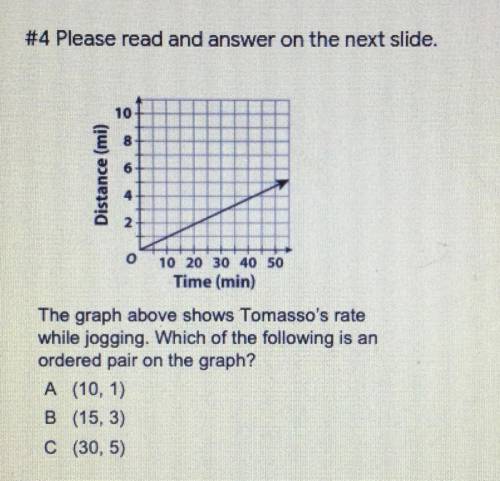
The graph above shows Tomasso's rate
while jogging. Which of the following is an
ordered pair on the graph?
A (10, 1)
B (15, 3)
C (30,5)

Answers: 1


Other questions on the subject: Mathematics
Mathematics, 21.06.2019 21:00, cinthyafleitas
What number line represents the solution set for the inequality -1/2 greater than or equal to 4
Answers: 1
Mathematics, 22.06.2019 07:00, jescanarias22
The diagram shows how an image is produced by a plane mirror. which letter shows where the image will be produced?
Answers: 1
Mathematics, 22.06.2019 11:00, donuteatingcat
The following data show the number of field goals a kicker attempted each game. make a data display and tell which number of field goals is the mode.4,6,2,1,3,1,2,1,5,2,2,3
Answers: 1
You know the right answer?
Questions in other subjects:


English, 07.11.2019 21:31

Mathematics, 07.11.2019 21:31
Mathematics, 07.11.2019 21:31


