Which could likely be the variables represented in the scatter plot
shown?
A. The population...

Mathematics, 18.03.2021 19:30 AliMe52
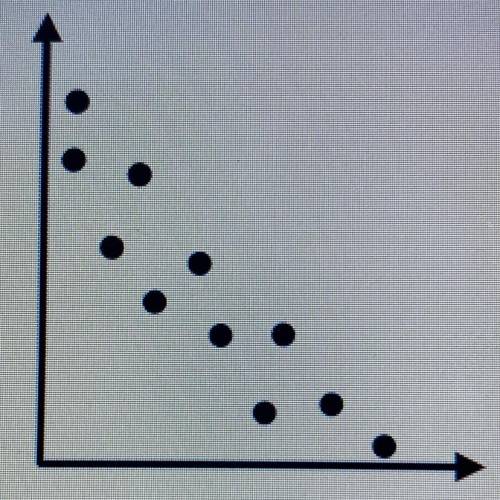
Which could likely be the variables represented in the scatter plot
shown?
A. The population of a city and the number of houses in the city.
B. The number of buildings in a city and the number of trees in the city.
C. The number of cars in a city and the pollution level of the city.
D. The population of a city and the number of letters in the city's name.

Answers: 3


Other questions on the subject: Mathematics
Mathematics, 21.06.2019 18:00, mdlemuslopez
The graph shown is the graph of which function?
Answers: 2
Mathematics, 21.06.2019 20:00, lucerogon7403
How can you construct perpendicular lines and prove theorems about perpendicular lines
Answers: 3
You know the right answer?
Questions in other subjects:

Biology, 26.10.2019 06:43


History, 26.10.2019 06:43


History, 26.10.2019 06:43
Mathematics, 26.10.2019 06:43


