
Mathematics, 18.03.2021 18:50 tiaholmes31
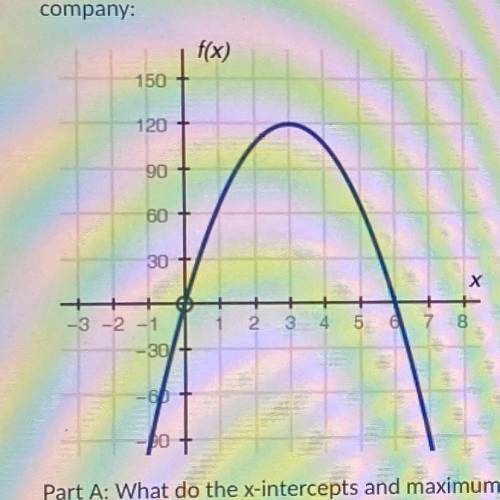
The graph below shows a company's profit f(x), in dollars, depending on the price of goods x, in dollars, being sold by the
company:
Part A: What do the x-intercepts and maximum value of the graph represent?
Part B: What are the intervals where the function is increasing and decreasing, and what do they represent about the sale and
profit?
Part C: What is an approximate average rate of change of the graph from x - 1 to x = 3, and what does this rate represent?

Answers: 2


Other questions on the subject: Mathematics
Mathematics, 21.06.2019 17:00, karina1466
What is the value of the expression 9+n/3-6 when n = 12? 1. 5. 7. 12.
Answers: 1
Mathematics, 21.06.2019 22:00, nshuey0930
Worth 100 points need the answers asap first row -x^2 2x^2 (x/2)^2 x^2 x is less than 2 x is greater than 2 x is less than or equal to 2 x is greater than or equal to 2 second row -5 -5/2 4 5 •2 is less than x& x is less than 4 •2 is less than or equal to x & x is less than or equal to 4 •2 is less than or equal to x& x is less than 4 •2 is less than x& x is less than or equal to 4
Answers: 2
You know the right answer?
The graph below shows a company's profit f(x), in dollars, depending on the price of goods x, in dol...
Questions in other subjects:
Mathematics, 31.07.2021 16:50

English, 31.07.2021 16:50
English, 31.07.2021 16:50
English, 31.07.2021 16:50


