
Mathematics, 18.03.2021 18:50 prissydizzybella5
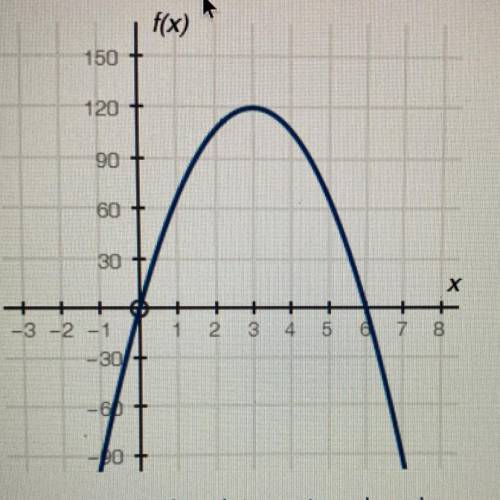
The graph below shows a company's profit f(x), in dollars, depending on the price of goods x. in dollars, being sold by the
company:
Part A: What do the x-intercepts and maximum value of the graph represent?
Part B: What are the intervals
where the function is increasing and decreasing, and what do they represent about the sale and
profit?
Part C: What is an approximate average rate of change of the graph from x = 1 to x = 3, and what does this rate represent?

Answers: 3


Other questions on the subject: Mathematics
Mathematics, 21.06.2019 14:00, zariasimone2
What is the slope of a line that is perpendicular to y = 3x + 1
Answers: 1
Mathematics, 21.06.2019 17:00, sophiawatson70
Line gh passes through points (2, 5) and (6, 9). which equation represents line gh? y = x + 3 y = x – 3 y = 3x + 3 y = 3x – 3
Answers: 1
Mathematics, 21.06.2019 18:00, hendersontianna05
Pat listed all the numbers that have 15 as a multiple write the numbers in pats list
Answers: 3
Mathematics, 21.06.2019 22:00, natetheman7740
Given: △acm, m∠c=90°, cp ⊥ am , ac: cm=3: 4, mp-ap=1. find am.
Answers: 2
You know the right answer?
The graph below shows a company's profit f(x), in dollars, depending on the price of goods x. in dol...
Questions in other subjects:
Mathematics, 05.02.2021 01:00

Mathematics, 05.02.2021 01:00
Mathematics, 05.02.2021 01:00

Chemistry, 05.02.2021 01:00

Mathematics, 05.02.2021 01:00


