
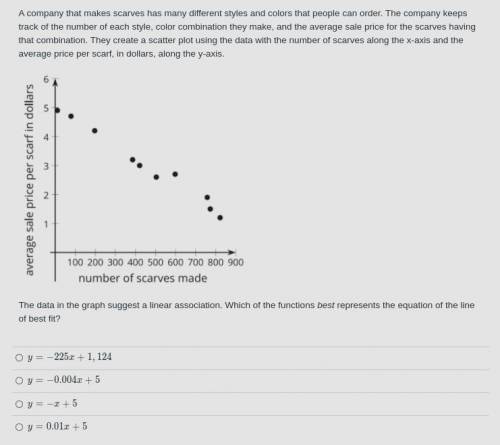
Mathematics, 18.03.2021 05:20 natalie2sheffield
The data in the graph suggest a linear association. Which of the functions best represents the equation of the line of best fit?
PLS HELP THANKS! :)
(choose answer 1,2,3, or 4)

Answers: 1


Other questions on the subject: Mathematics
Mathematics, 21.06.2019 16:10, cuppykittyy
The probability that a college student belongs to a health club is 0.3. the probability that a college student lives off-campus is 0.4. the probability that a college student belongs to a health club and lives off-campus is 0.12. find the probability that a college student belongs to a health club or lives off-campus. tip: p(a or b) = p(a) + p(b) - p(a and b) 0.54 0.58 0.70 0.82
Answers: 2
Mathematics, 21.06.2019 17:00, cat216
Omar is going on a road trip! the car rental company offers him two types of cars. each car has a fixed price, but he also needs to consider the cost of fuel. the first car costs $90 to rent, and because of its fuel consumption rate, there's an additional cost of s0.50 per kilometer driven.
Answers: 2
Mathematics, 21.06.2019 20:30, Trinhphuongtran
You have a square piece of cardboard that measures 14 inches on each side. to build a box, you cut congruent squares out of each corner of the cardboard. use the picture to find the area of the cardboard you were used to build the box
Answers: 2
You know the right answer?
The data in the graph suggest a linear association. Which of the functions best represents the equat...
Questions in other subjects:

Mathematics, 02.02.2021 20:50

Mathematics, 02.02.2021 20:50


Spanish, 02.02.2021 20:50
Mathematics, 02.02.2021 20:50


