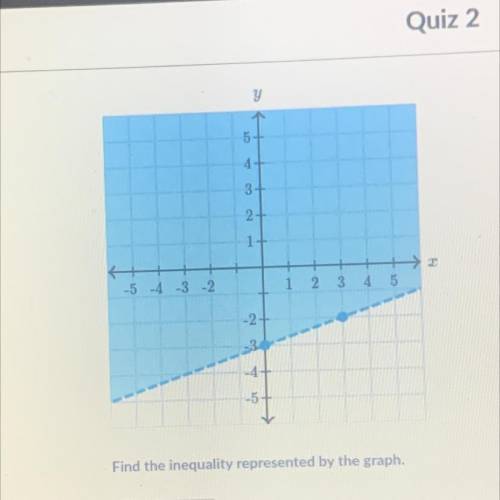
Find the inequality represented by the graph. Please help
...

Mathematics, 18.03.2021 05:00 Maria3737
Find the inequality represented by the graph. Please help

Answers: 3


Other questions on the subject: Mathematics
Mathematics, 21.06.2019 12:30, mparra4761
Arandom sample of 240 park users were asked if they go to the park more often on weekdays or on the weekend. the results are shown in the table. weekdays weekend male 50 10 female 150 30 based on the data in the table, select correct or incorrect for each statement. correct incorrect the males go to the park more often on the weekend. the females go to the park more often on weekdays. for the participants in the survey, gender affects which days of the week a person goes to the park.
Answers: 1
Mathematics, 21.06.2019 18:00, mooreadrian412
The brain volumes (cm cubed) of 50 brains vary from a low of 904 cm cubed to a high of 1488 cm cubed. use the range rule of thumb to estimate the standard deviation s and compare the result to the exact standard deviation of 175.5 cm cubed, assuming the estimate is accurate if it is within 15 cm cubed
Answers: 2
Mathematics, 21.06.2019 21:10, Marshmallow6989
Patty made a name tag in the shape of a parallelogram. reilly made a rectangular name tag with the same base and height. explain how the areas of the name tags compare.
Answers: 2
You know the right answer?
Questions in other subjects:


Mathematics, 05.03.2020 23:58


