
Mathematics, 18.03.2021 03:10 countessbianca
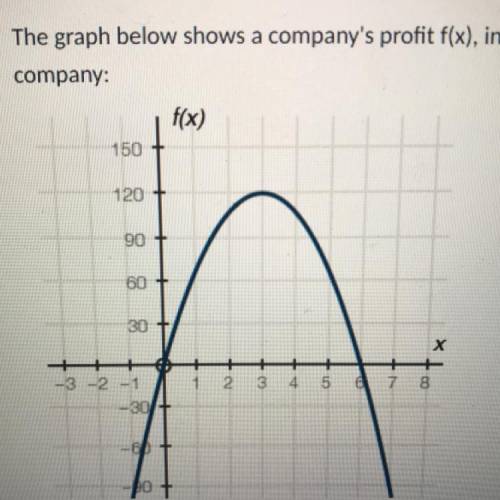
The graph below shows a company's profit f(x), in dollars, depending on the price of goods x, in dollars, being sold by the
company:
Part A: What do the x-intercepts and maximum value of the graph represent?
Part B: What are the intervals where the function is increasing and decreasing, and what do they represent about the sale and profit?
Part C: What is an approximate average rate of change of the graph from x = 1 to x = 3, and what does this rate represent?

Answers: 3


Other questions on the subject: Mathematics
Mathematics, 21.06.2019 21:30, hammackkatelyn60
Joanie wrote a letter that was 1 1/4 pages long. katie wrote a letter that was 3/4 page shorter then joagies letter. how long was katies letter
Answers: 1
Mathematics, 22.06.2019 03:10, kadestew21
47: 4 aisha changed 1.45 + 2.38 to 1.5 + 2.4 in order to estimate the sum. what estimation method did she use?
Answers: 1
Mathematics, 22.06.2019 04:00, rainbowboy6055
Angle 1 and 2 are a linear pair. angle 1 equals x-39 and angle 2 equals x+61 . find the measure of each angle
Answers: 1
You know the right answer?
The graph below shows a company's profit f(x), in dollars, depending on the price of goods x, in dol...
Questions in other subjects:
Mathematics, 13.04.2021 01:10
Mathematics, 13.04.2021 01:10


Business, 13.04.2021 01:10
Mathematics, 13.04.2021 01:10


