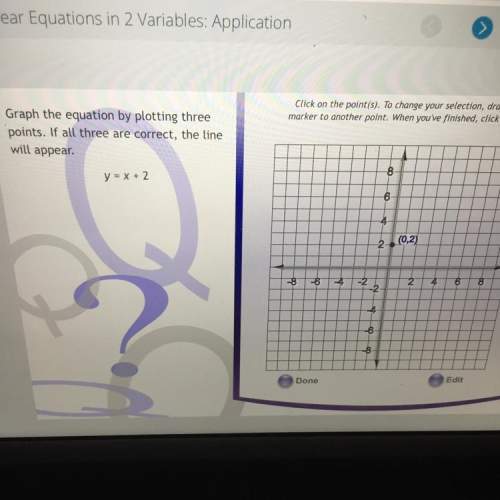
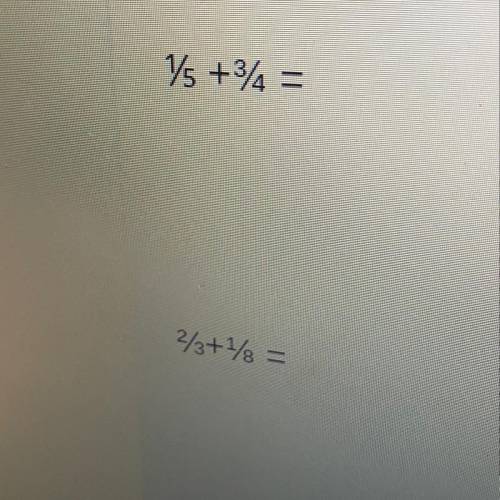
Please anyone help me with these to questions please
...

Mathematics, 18.03.2021 03:00 nothingworksoutforme
Please anyone help me with these to questions please

Answers: 1


Other questions on the subject: Mathematics
Mathematics, 21.06.2019 19:00, jackieanguiano3700
Solve the problem. a student earned grades of c, a, b, and a in four different courses. those courses had these corresponding numbers of credit hours: 4, 5, 1, and 5. the grading system assigns quality points to letter grades as follows: a = 4, b = 3, c = 2, d = 1, and f = 0. compute the grade point average (gpa) and round the result to two decimal places. 3.40 3.50 8.75 2.18
Answers: 1
Mathematics, 21.06.2019 20:00, anabelleacunamu
Find the value of x. round the length to the nearest tenth
Answers: 1
Mathematics, 22.06.2019 02:20, jdkrisdaimcc11
The students at jefferson middle school are raising money for a charity by selling t-shirts and hats. the number of t-shirts sold was 3 times the number of hats. the profit was $5 for each t-shirt sold and $2.50 for each hat sold. the students raised $840 for the charity. they used the system below to analyze their success and found the solution to be (144, 48). 5x+2.50y=840 x=3y how much did they earn from t-shirt sales?
Answers: 2
Mathematics, 22.06.2019 02:30, misk980
Atrain traveled for 1.5 hours to the first station, stopped for 30 minutes, then traveled for 4 hours to the final station where it stopped for 1 hour. the total distance traveled is a function of time. which graph most accurately represents this scenario? a graph is shown with the x-axis labeled time (in hours) and the y-axis labeled total distance (in miles). the line begins at the origin and moves upward for 1.5 hours. the line then continues upward at a slow rate until 2 hours. from 2 to 6 hours, the line continues quickly upward. from 6 to 7 hours, it moves downward until it touches the x-axis a graph is shown with the axis labeled time (in hours) and the y axis labeled total distance (in miles). a line is shown beginning at the origin. the line moves upward until 1.5 hours, then is a horizontal line until 2 hours. the line moves quickly upward again until 6 hours, and then is horizontal until 7 hours a graph is shown with the axis labeled time (in hours) and the y-axis labeled total distance (in miles). the line begins at the y-axis where y equals 125. it is horizontal until 1.5 hours, then moves downward until 2 hours where it touches the x-axis. the line moves upward until 6 hours and then moves downward until 7 hours where it touches the x-axis a graph is shown with the axis labeled time (in hours) and the y-axis labeled total distance (in miles). the line begins at y equals 125 and is horizontal for 1.5 hours. the line moves downward until 2 hours, then back up until 5.5 hours. the line is horizontal from 5.5 to 7 hours
Answers: 1
You know the right answer?
Questions in other subjects:
Mathematics, 13.02.2021 06:00
Mathematics, 13.02.2021 06:00
Mathematics, 13.02.2021 06:00

Physics, 13.02.2021 06:00


Physics, 13.02.2021 06:00
Mathematics, 13.02.2021 06:00


