
Mathematics, 18.03.2021 02:50 AngelyAce
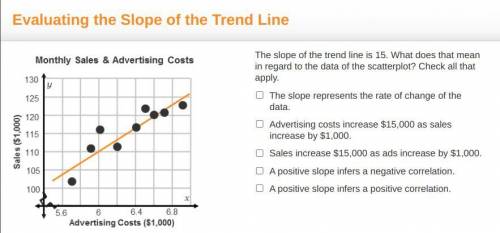
A graph titled Monthly Sales and Advertising Costs has Advertising Costs (1,000 dollars) on the x-axis and sales (1,000 dollars) on the y-axis. A line goes through points (6.4, 117) and (6.6, 120). The slope of the trend line is 15. What does that mean in regard to the data of the scatterplot? Check all that apply. The slope represents the rate of change of the data. Advertising costs increase $15,000 as sales increase by $1,000. Sales increase $15,000 as ads increase by $1,000. A positive slope infers a negative correlation. A positive slope infers a positive correlation.

Answers: 2


Other questions on the subject: Mathematics
Mathematics, 21.06.2019 14:10, kyrabrown33
Line cd passes through points c(1, 3) and d(4, –3). if the equation of the line is written in slope-intercept form, y = mx + b, what is the value of b? –5 –2 1 5
Answers: 2
Mathematics, 21.06.2019 15:30, potato1458
What is the best reason for jacinta to have a savings account in addition to a checking account
Answers: 1
You know the right answer?
A graph titled Monthly Sales and Advertising Costs has Advertising Costs (1,000 dollars) on the x-ax...
Questions in other subjects:

English, 27.10.2021 07:20
English, 27.10.2021 07:20
Mathematics, 27.10.2021 07:20
Mathematics, 27.10.2021 07:20
Mathematics, 27.10.2021 07:20
Mathematics, 27.10.2021 07:20


