
Mathematics, 18.03.2021 02:50 oneicyahdaley10
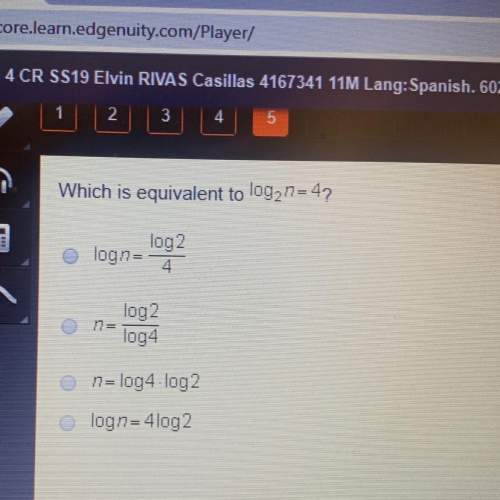
Which data set could be represented by the box plot shown below?
A horizontal boxplot is plotted along a horizontal axis marked from 40 to 50, in increments of 1. A left whisker extends from 41 to 43. The box extends from 43 to 48 and is divided into 2 parts by a vertical line segment at 44. The right whisker extends from 48 to 50. All values estimated.
Choose 1
(Choice A)
41, 42, 42, 43, 43, 47, 47, 49, 50, 50
(Choice B)
40, 42, 43, 43, 43, 47, 47, 48, 50, 50
(Choice C)
C
41, 42, 43, 43, 43, 45, 47, 49, 50, 50
(Choice D)
D
41, 42, 43, 43, 43, 45, 47, 48, 50, 50

Answers: 1


Other questions on the subject: Mathematics
Mathematics, 21.06.2019 15:20, lambobacon9027
Classify the following triangle check all that apply
Answers: 2
Mathematics, 21.06.2019 17:00, ladnerhailey16
What is sin 7x/4 ? i need on this urgent trig
Answers: 1
Mathematics, 21.06.2019 23:00, keishadawson
Could someone me with this question i’ve been stuck on it for 20 minutes
Answers: 1
You know the right answer?
Which data set could be represented by the box plot shown below?
A horizontal boxplot is plotted a...
Questions in other subjects:

Health, 15.10.2020 04:01

Mathematics, 15.10.2020 04:01


Chemistry, 15.10.2020 04:01


Mathematics, 15.10.2020 04:01


