
Mathematics, 18.03.2021 02:30 erikamaldonado661
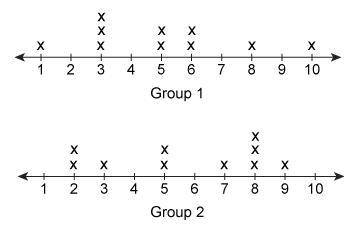
The line plot shows the results of a survey of two groups of 10 kids on how many ice cream cones they ate in the month. Which conclusion can be drawn about the data?
The overlap between Group 1 and Group 2 is low.
The median of Group 2 is greater than the median of Group 1.
The mode is the same for both sets of data.
The range for Group 2 is greater than the range for Group 1.

Answers: 3


Other questions on the subject: Mathematics
Mathematics, 21.06.2019 23:40, asiababbie33
Agrid shows the positions of a subway stop and your house. the subway stop is located at (-5,2) and your house is located at (-9,9). what is the distance, to the nearest unit, between your house and the subway stop?
Answers: 1
Mathematics, 22.06.2019 00:00, notashley1703
Write the equation in general quadratic form: plz !
Answers: 1
You know the right answer?
The line plot shows the results of a survey of two groups of 10 kids on how many ice cream cones the...
Questions in other subjects:

Biology, 11.02.2020 23:27


Social Studies, 11.02.2020 23:27

Physics, 11.02.2020 23:27


