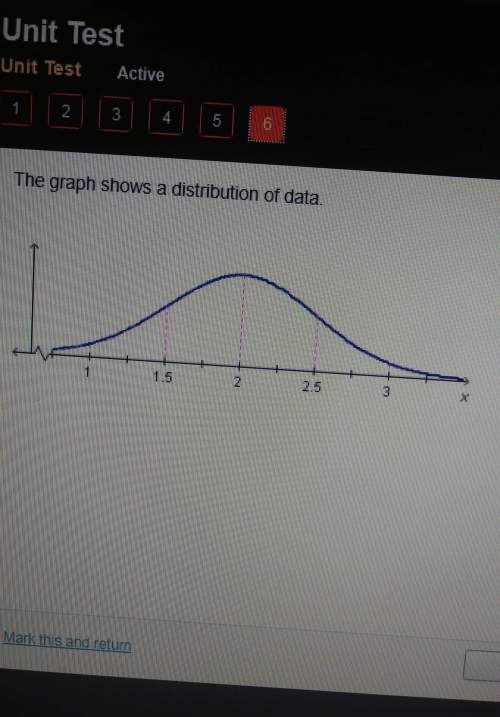
This dot plot is symmetric, and the data set has no
extreme values.
1 2 3 4 5 6
12
...

Mathematics, 18.03.2021 02:30 kalieghcook
This dot plot is symmetric, and the data set has no
extreme values.
1 2 3 4 5 6
12
9 10
Which of these measures is the best measure of variability for the dot plot?
O A. Mean absolute deviation (MAD)
B. Mean
C. Interquartile range (IQR)
D. Median

Answers: 3


Other questions on the subject: Mathematics

Mathematics, 21.06.2019 13:00, andregijoe41
Which expression is equivalent to −16y+13 ? −16(−y+13) 16(−y+2) −16(y+2) 16(−y+13)
Answers: 1


Mathematics, 21.06.2019 16:50, Chartwig4831
For the equations below which statement is true ? -2x=14 6x=-42
Answers: 1

Mathematics, 21.06.2019 20:00, angelisabeast5430
Rectangle bcde is similar to rectangle vwxy. what is the length of side vy? a) 1 7 b) 2 7 c) 3 7 d) 4 7
Answers: 3
You know the right answer?
Questions in other subjects:


Arts, 25.01.2021 20:00


Mathematics, 25.01.2021 20:00


