
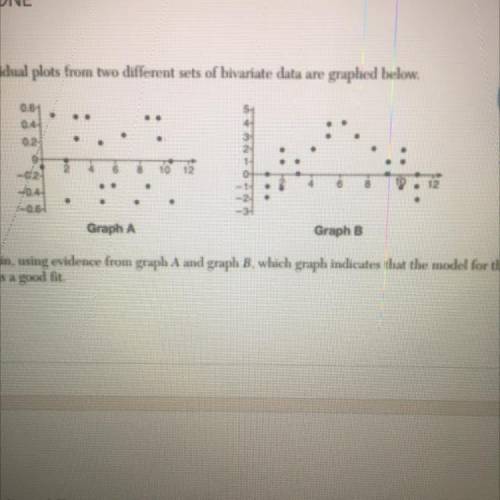
5) The residual plots from two different sets of bivariate data are graphed below.
Math
Expla...

Mathematics, 18.03.2021 02:10 whitems33982
5) The residual plots from two different sets of bivariate data are graphed below.
Math
Explain, using evidence from graph A and graph B. which graph indicates that the model for the
data is a good fit

Answers: 3


Other questions on the subject: Mathematics
Mathematics, 21.06.2019 19:10, dylancasebere
What is the quotient of m^6/5 ÷ 5/m^2? assume m does not equal pl
Answers: 1
Mathematics, 22.06.2019 00:00, mkay78
Apassenger train and a freight train leave san jose at 3pm, traveling in the same direction. the passenger train is going three times as fast as the freight train. at 6pm they are 240 miles apart. how fast is each travelling? explain your answer and show your
Answers: 1
You know the right answer?
Questions in other subjects:


Social Studies, 24.12.2021 23:50
Mathematics, 24.12.2021 23:50


