
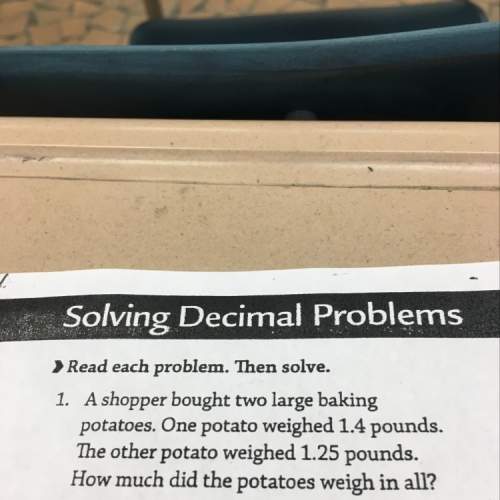
Mathematics, 18.03.2021 02:10 w210138937
1. Think of a situation in which you compare the relationship between 2 variables (x,_) and (y,_). 20pts
2. Construct a scatter plot of data for the situation. 20pts
3.Draw a Trend Line 20pts
4. Use the scatter plot to identify and interpret the relationship between the data. What association does your graph represent? Is it Positive, Negative, or No association? Is it Strong Weak, or Moderate? 20pts
5. Make a prediction for an outcome based on your trend line not listed on the original graph and show your work. 20pts


Answers: 2


Other questions on the subject: Mathematics
Mathematics, 21.06.2019 16:00, Jenifermorales101
The equation x2 – 1x – 90 = 0 has solutions {a, b}. what is a + b?
Answers: 1
Mathematics, 21.06.2019 20:00, brevenb375
What effect would doubling all the dimensions of a triangular pyramid have on the volume of the pyramid? explain your reasoning.
Answers: 1
Mathematics, 21.06.2019 21:30, BARRION1981
Over the course of the school year, you keep track of how much snow falls on a given day and whether it was a snow day. your data indicates that of twenty-one days with less than three inches of snow, five were snow days, while of the eight days with more than three inches of snow, six were snow days. if all you know about a day is that it is snowing, what is the probability that it will be a snow day?
Answers: 1
Mathematics, 21.06.2019 22:10, layshjjbradshaw7250
What is the area of the original rectangle? 8 cm² 20 cm² 25 cm² 40 cm²
Answers: 1
You know the right answer?
1. Think of a situation in which you compare the relationship between 2 variables (x,_) and (y,_). 2...
Questions in other subjects:


Chemistry, 01.07.2020 15:01

Physics, 01.07.2020 15:01
Mathematics, 01.07.2020 15:01


