
Mathematics, 18.03.2021 01:20 naomicervero
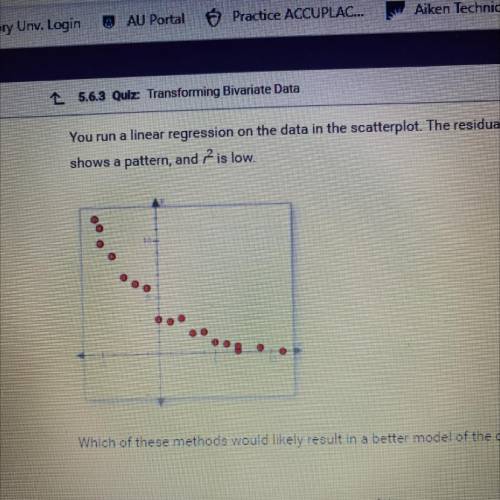
You run a linear regression on the data in the scatterplot. The residual plot
shows a pattern, and is low.
Which of these methods would likely result in a better model of the data?
A. Linearize the data by taking the log of the response variable, and
then run an exponential regression
B. Linearize the data by taking the logs of both variables, and then
run a linear regression
C. Linearize the data by taking the log of the response variable, and
then run a linear regression
D. Run a quadratic regression on the data and then linearize the data.

Answers: 2


Other questions on the subject: Mathematics
Mathematics, 21.06.2019 18:00, ddavid9361
Li buys supplies so he can make and sell key chains. he begins to make a profit only after he sells 4 key chains. what point on the graph makes the most sense in this situation?
Answers: 2
Mathematics, 21.06.2019 18:00, sammilower04
Write an equation in slope intercept form of the line passes through the given point and is parallel to the graph of the given equation (0,0); y=3/8 x+2
Answers: 1
Mathematics, 21.06.2019 20:00, GreatBaconGamer
Solve for x and y a x= 13.3 y= 16.7 b x= 23.3 y= 12.5 c x= 7.5 y= 16.7 d x=7.5 y= 12.5
Answers: 1
Mathematics, 21.06.2019 21:10, linettepizarro1233
See attachment below and find the equivalent of tan(∠qsr)
Answers: 3
You know the right answer?
You run a linear regression on the data in the scatterplot. The residual plot
shows a pattern, and...
Questions in other subjects:

Advanced Placement (AP), 17.01.2022 04:00

History, 17.01.2022 04:00


Mathematics, 17.01.2022 04:00
Mathematics, 17.01.2022 04:00

World Languages, 17.01.2022 04:00


