The graph shows the relationship between the
number of cubic yards of mulch ordered and the
t...

Mathematics, 18.03.2021 01:10 TheOriginalMeyah
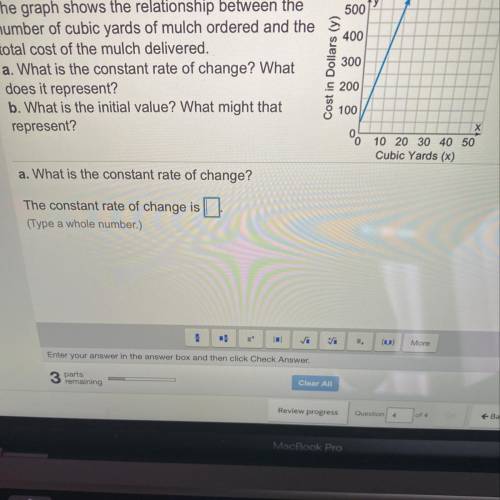
The graph shows the relationship between the
number of cubic yards of mulch ordered and the
total cost of the mulch delivered.
a. What is the constant rate of change? What
does it represent?
b. What is the initial value? What might that
represent?

Answers: 3


Other questions on the subject: Mathematics
Mathematics, 21.06.2019 23:00, benwill0702
The sum of 5consecutive even numbers is 100. what is the first number in this sequence?
Answers: 1
Mathematics, 22.06.2019 06:00, stotherow5
Follow these steps to derive the trigonometric area formula.
Answers: 1
You know the right answer?
Questions in other subjects:


Mathematics, 17.11.2020 20:00
Mathematics, 17.11.2020 20:00

Biology, 17.11.2020 20:00
Mathematics, 17.11.2020 20:00
History, 17.11.2020 20:00


