
Mathematics, 18.03.2021 01:00 itzia00
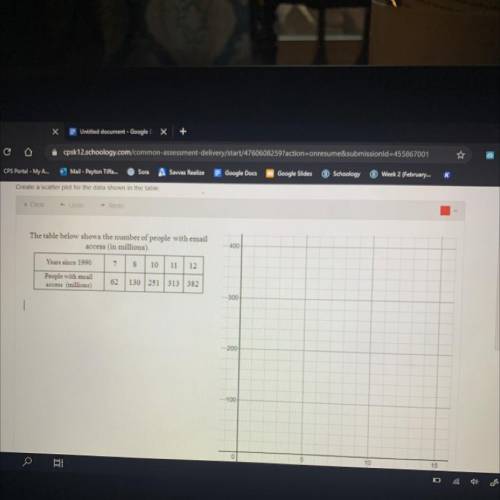
Create a scatter plot for the data shown in the table.
The table below shows the number of people with email
access (in millions).
Years since 1990 7 8 10 11 12
People with email
62 130 251 313 382
access (millions)
-300
-200
-100

Answers: 3


Other questions on the subject: Mathematics
Mathematics, 21.06.2019 18:30, alleahbethea199
Divide. write in the simplest form. 4 1/6 divided by 10
Answers: 2
Mathematics, 21.06.2019 22:00, shelovejaylocs
The median am of triangle ∆abc is half the length of the side towards which it is drawn, bc . prove that triangle ∆abc is a right triangle, and find angle mac and abm
Answers: 1
You know the right answer?
Create a scatter plot for the data shown in the table.
The table below shows the number of people w...
Questions in other subjects:

Physics, 20.11.2020 22:10
Mathematics, 20.11.2020 22:10
Mathematics, 20.11.2020 22:10
Mathematics, 20.11.2020 22:10
Mathematics, 20.11.2020 22:10
Mathematics, 20.11.2020 22:10

Social Studies, 20.11.2020 22:10


