
Mathematics, 17.03.2021 23:50 didirose
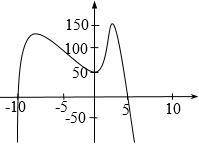
HELP PLZ AND THANKS The figure represents the graph of the function y=-x^4 -4x³ +14x² +14x -n which of the following could be the value of n? (A) -50 (B) -18 (C) 50 (D) 100 (E) 150

Answers: 3


Other questions on the subject: Mathematics
Mathematics, 21.06.2019 22:00, gerardoblk5931
Question 10 of 211 pointuse the elimination method to solve the system of equations. choose thecorrect ordered pair.10x +2y = 643x - 4y = -36a. (4,12)b. (-3, 11)c. (2,10)d. (-5, 8)
Answers: 1
You know the right answer?
HELP PLZ AND THANKS
The figure represents the graph of the function y=-x^4 -4x³ +14x² +14x -n which...
Questions in other subjects:

Mathematics, 14.02.2020 22:31


Spanish, 14.02.2020 22:31

Chemistry, 14.02.2020 22:31


