
Mathematics, 13.03.2021 02:40 davelopez979
I will give brainliest and 25 points
pls help me, I don't know how much longer I can stare at this question and please only answer part two, I already did part one and three. and pls include an explanation on how you found the answer. pls and thank you. and pls only put in an answer if you know, if you don't than pls don't put anything in. thank you
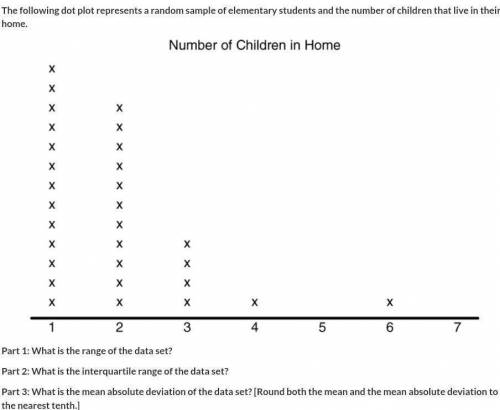
The following dot plot represents a random sample of elementary students and the number of children that live in their home. Part 1: What is the range of the data set? Part 2: What is the interquartile range of the data set? Part 3: What is the mean absolute deviation of the data set? [Round both the mean and the mean absolute deviation to the nearest tenth.]

Answers: 3


Other questions on the subject: Mathematics
Mathematics, 21.06.2019 20:10, dashawn3rd55
Over which interval is the graph of f(x) = x2 + 5x + 6 increasing?
Answers: 1
Mathematics, 21.06.2019 23:10, ineedhelp2285
The input to the function is x and the output is y. write the function such that x can be a vector (use element-by-element operations). a) use the function to calculate y(-1.5) and y(5). b) use the function to make a plot of the function y(x) for -2 ≤ x ≤ 6.
Answers: 1
You know the right answer?
I will give brainliest and 25 points
pls help me, I don't know how much longer I can stare at this...
Questions in other subjects:

Mathematics, 19.11.2020 19:50

Business, 19.11.2020 19:50
Mathematics, 19.11.2020 19:50

Geography, 19.11.2020 19:50

History, 19.11.2020 19:50

Health, 19.11.2020 19:50

Computers and Technology, 19.11.2020 19:50


