
Mathematics, 13.03.2021 01:00 santos36755
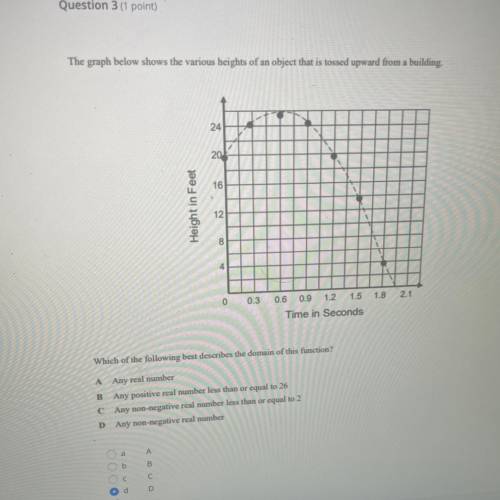
The graph below shows the various heights of an object that is tossed upward from a building.
24
20
16
Height in Feet
12
8
4
1.8
2.1
0
0.3
0.6 0.9 1.2 1.5
Time in Seconds
Which of the following best describes the domain of this function?
A
Any real number
B Any positive real number less than or equal to 26
C Any non-negative real number less than or equal to 2
D
Any non-negative real number

Answers: 3


Other questions on the subject: Mathematics
Mathematics, 21.06.2019 17:00, jesicaagan
Find the value of the variable and the length of each secant segment.
Answers: 1
Mathematics, 21.06.2019 21:00, rileyeddins1010
Which of the functions graphed below has a removable discontinuity?
Answers: 2
You know the right answer?
The graph below shows the various heights of an object that is tossed upward from a building.
24
Questions in other subjects:


History, 23.09.2019 23:00
History, 23.09.2019 23:00

Mathematics, 23.09.2019 23:00
History, 23.09.2019 23:00
Mathematics, 23.09.2019 23:00


