
Mathematics, 12.03.2021 20:10 katelynndonahue2393
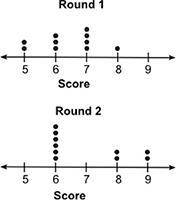
The dot plots below show the scores for a group of students who took two rounds of a quiz:
(See attached for image_
Which of the following inferences can be made using the dot plot? (5 points)
Question 13 options:
1)
The range of each round is the same.
2)
There is no overlap between the data.
3)
Round 1 scores were higher than round 2 scores.
4)
Round 2 scores were lower than round 1 scores.

Answers: 1


Other questions on the subject: Mathematics
Mathematics, 21.06.2019 17:40, sophiateaches053
If sec theta = 5/3 and the terminal point determined by theta is in quadrant 4, then
Answers: 1
Mathematics, 21.06.2019 22:00, iamsecond235p318rq
Find the greatest common factor of the followig monomials 46g^2h and 34g^6h^6
Answers: 1
Mathematics, 21.06.2019 22:30, imanim3851
If you prove that ∆wxz is congruent to ∆yzx, which general statement best describes what you have proved?
Answers: 3
You know the right answer?
The dot plots below show the scores for a group of students who took two rounds of a quiz:
(See att...
Questions in other subjects:

Mathematics, 10.03.2020 06:09

History, 10.03.2020 06:09
History, 10.03.2020 06:09

History, 10.03.2020 06:09


